Record a slope profile
Learn draw → calibrate → record → review → export or add using a separate Slope quality practice (simulated) project. This optional field-tool lesson follows the four-part global walkthrough; it does not change its 39 sites or 51 features.
Simulated practice, real application screens
The screenshots show the current local Mapplex interface in night mode with satellite imagery, including quality settings, reading age and resumable saves. Orientation and location inputs were simulated for a fictional New York section. They are not terrain measurements, a device-accuracy test or a demonstration of successful GPS acquisition. The exported values and resulting local layers were checked against those inputs.
1. Prepare a separate practice project
Create and activate a local project named Slope quality practice (simulated). Start with no layers or features. You need access to Slope Profiler and, for real fieldwork, a device with responsive orientation input and a checked location.
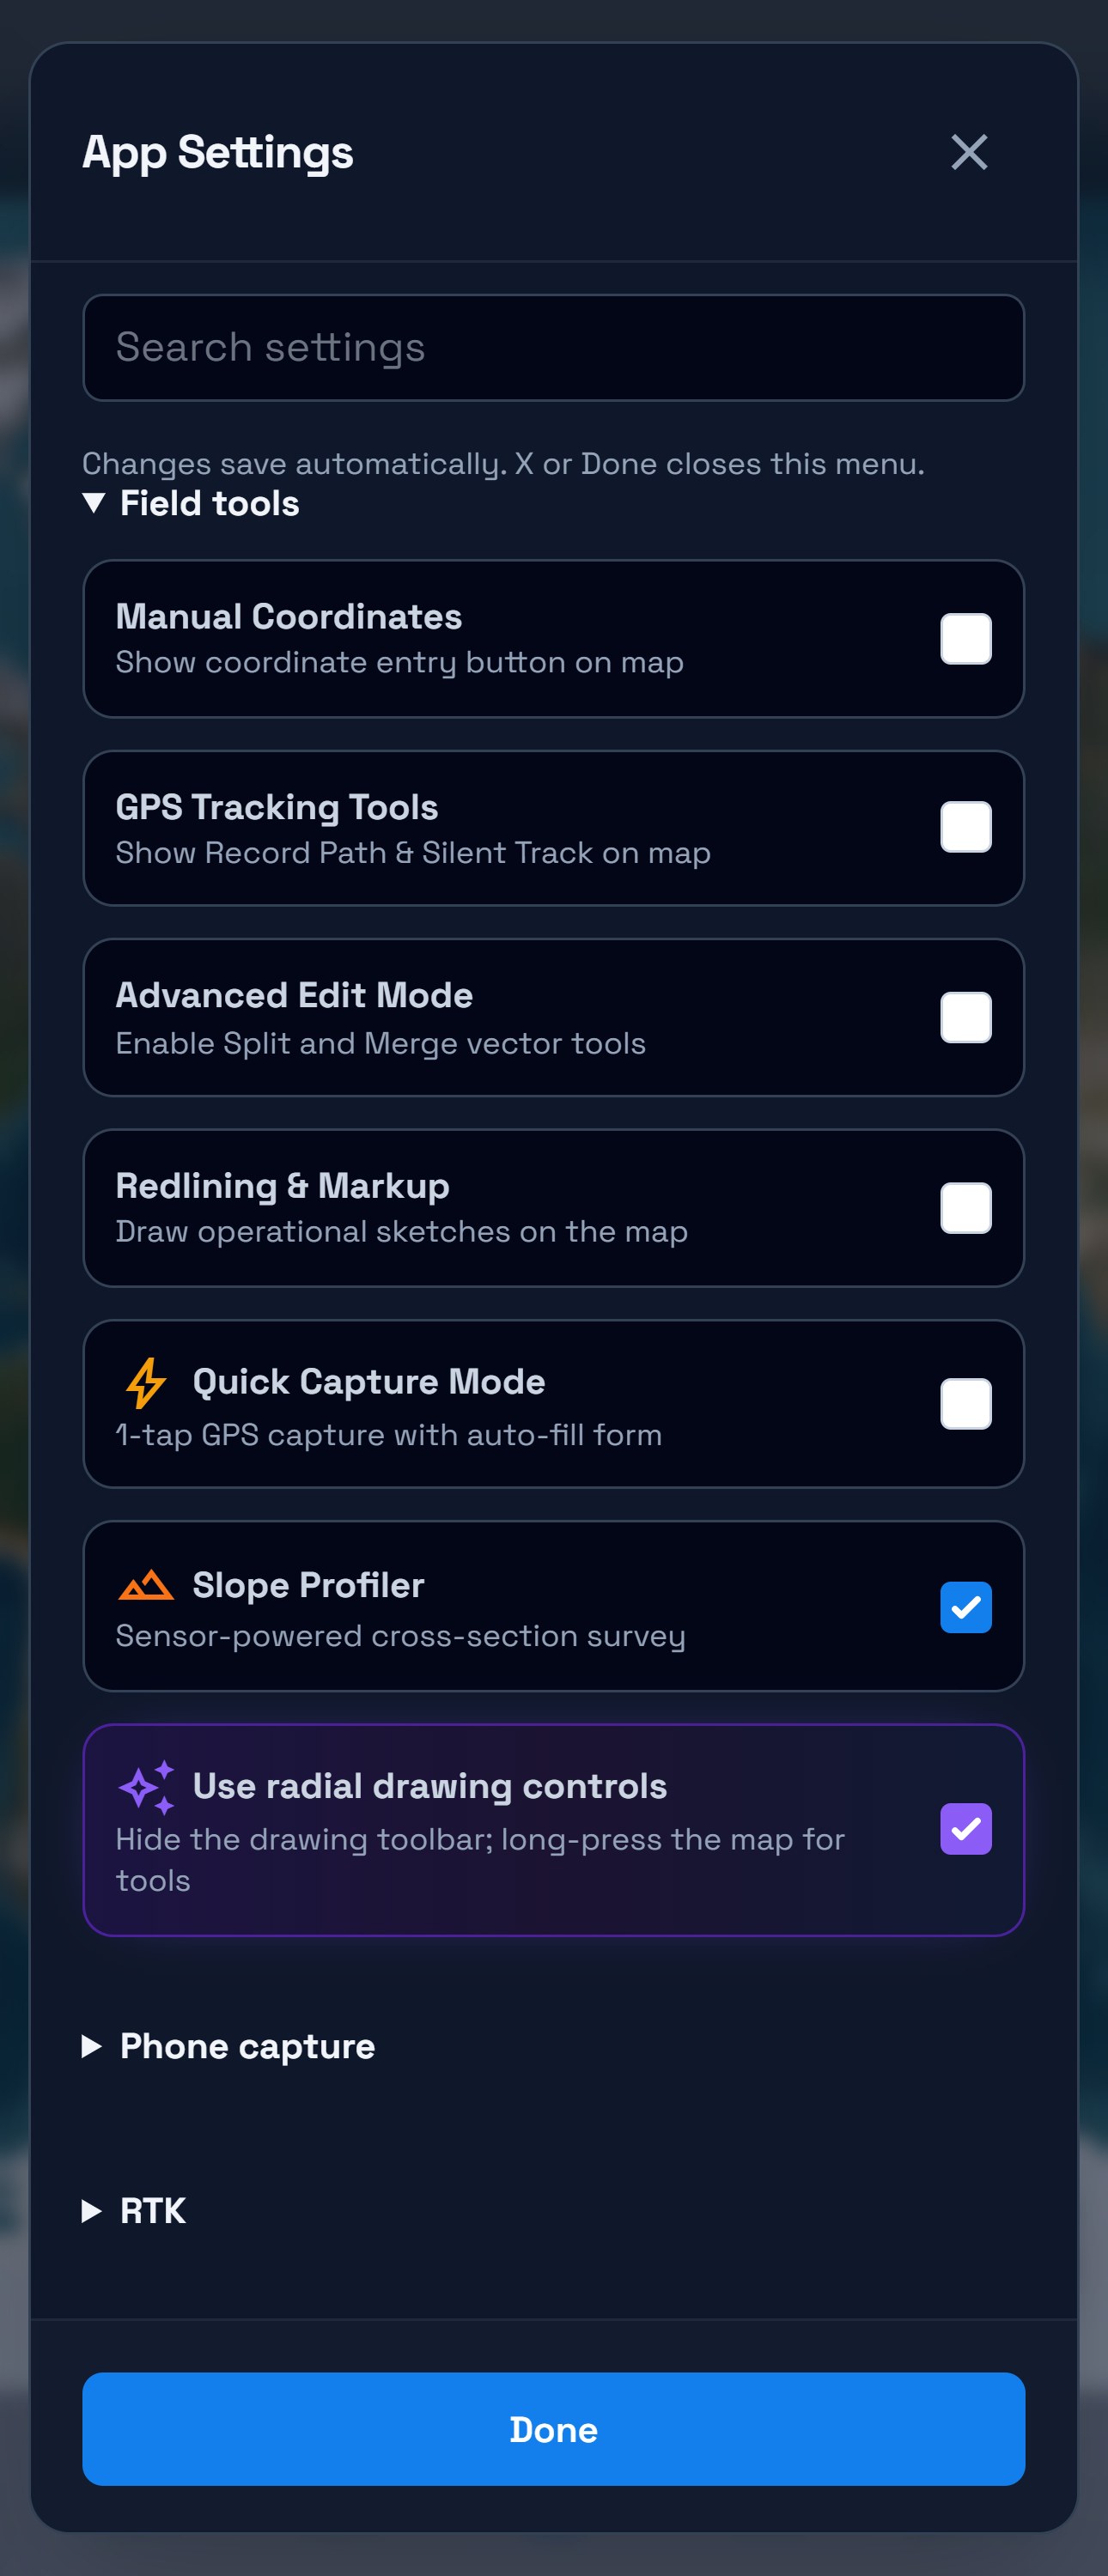
Open Map → Settings → Field tools, enable Slope Profiler, and choose Done. Quick Capture can remain off. Finish or cancel any other drawing or measurement operation before opening the orange profiler button.
2. Draw the baseline and set zero
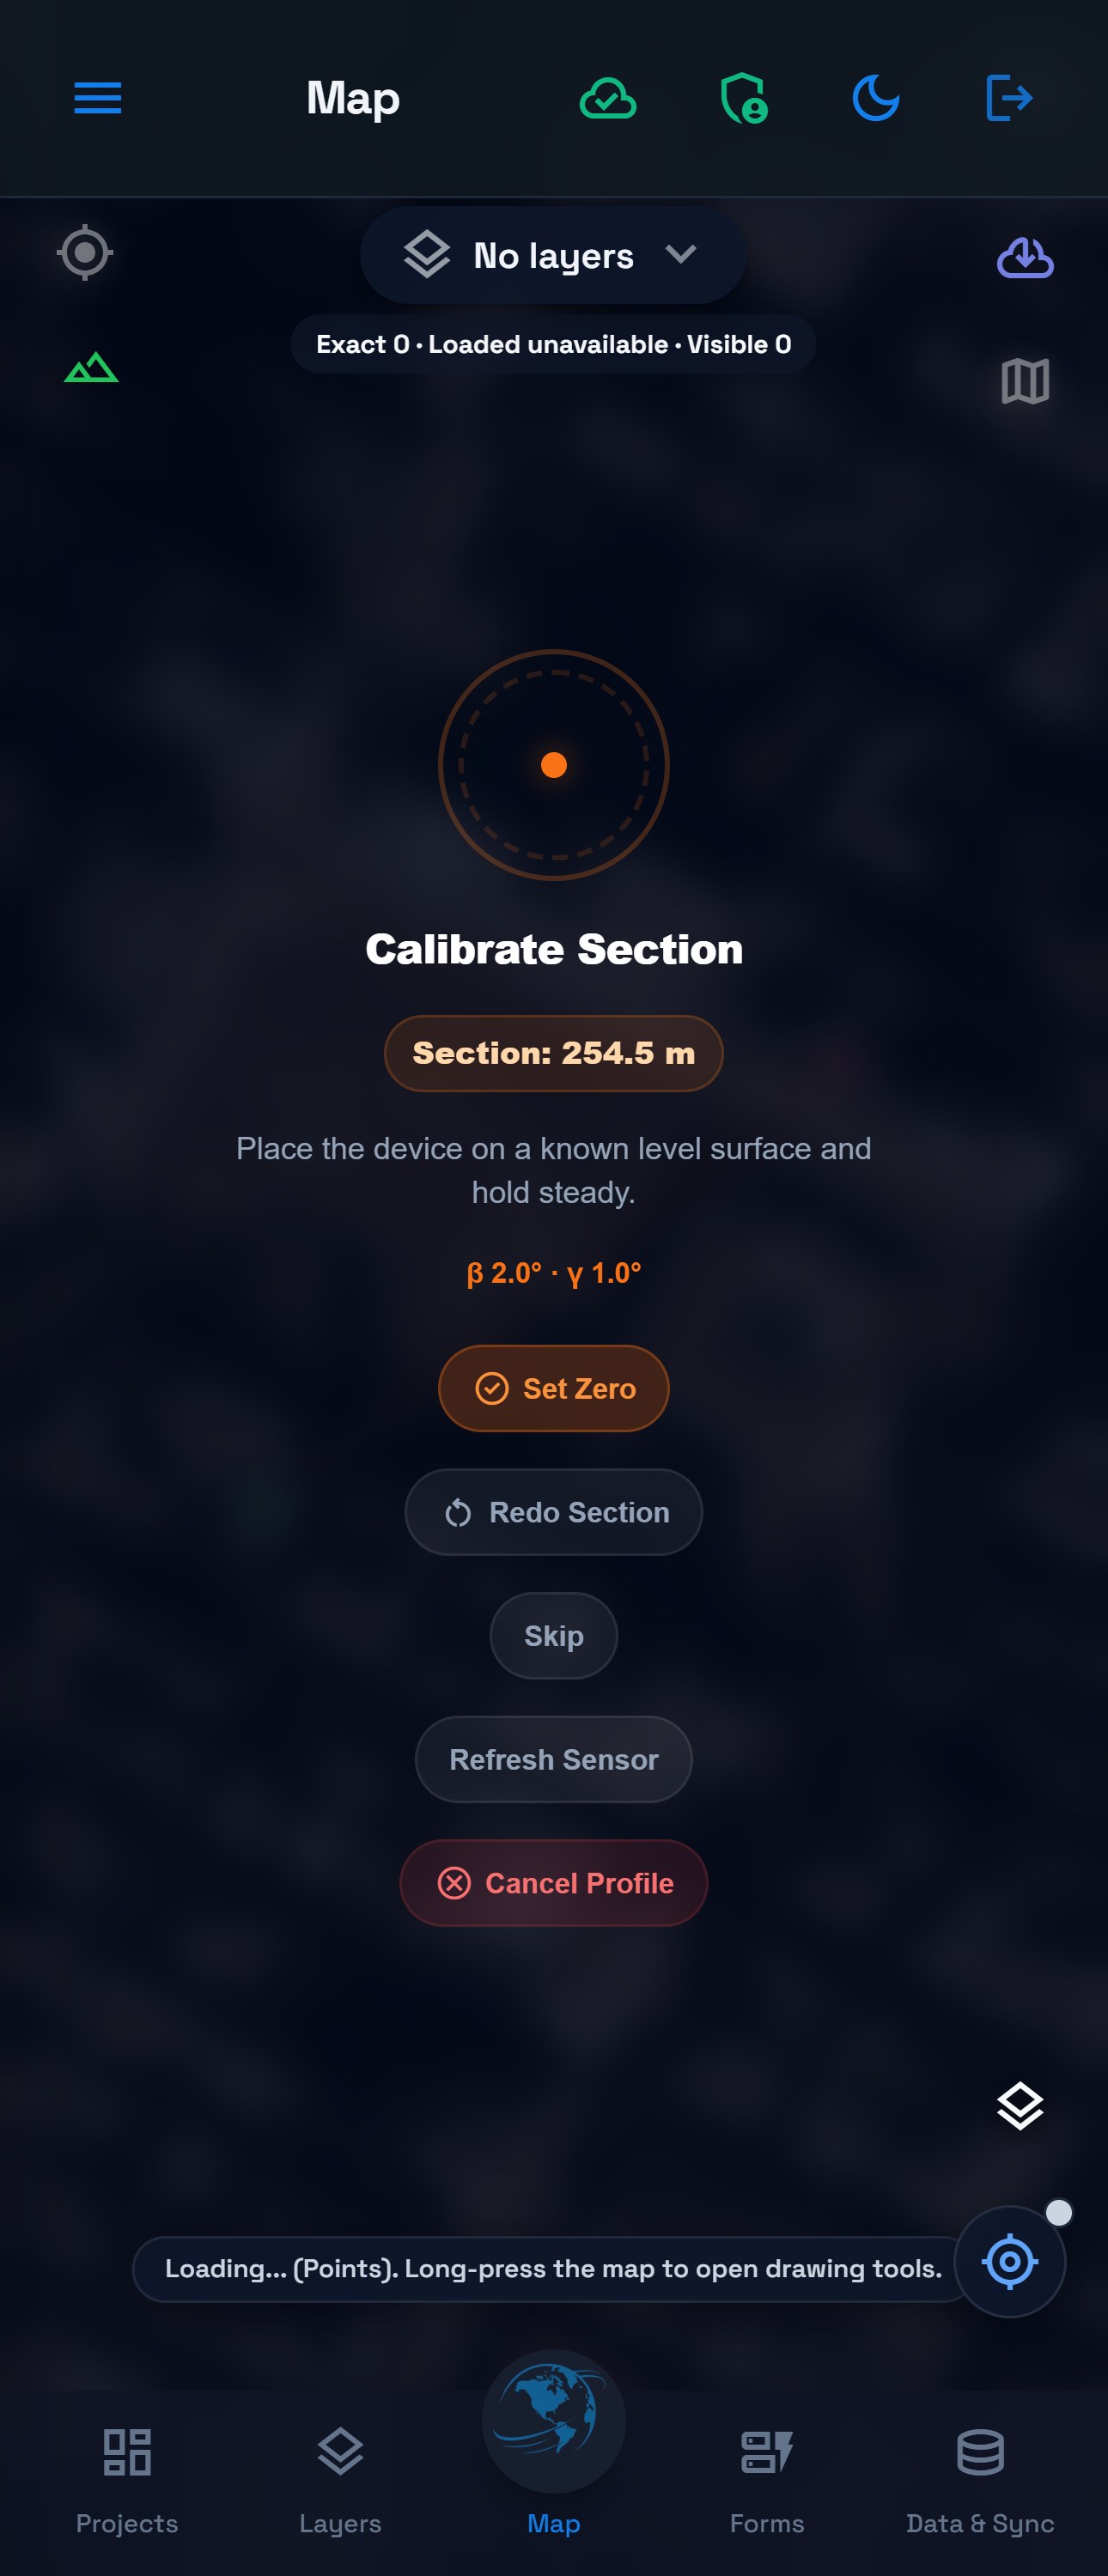
Choose Draw Section, tap A, then B, and tap the last vertex again to finish the line. For this example, A is near 40.7528, −73.9842 and B near 40.7542, −73.9818. The captured baseline is about 254.48 m long; drawing by hand can produce slightly different endpoints.
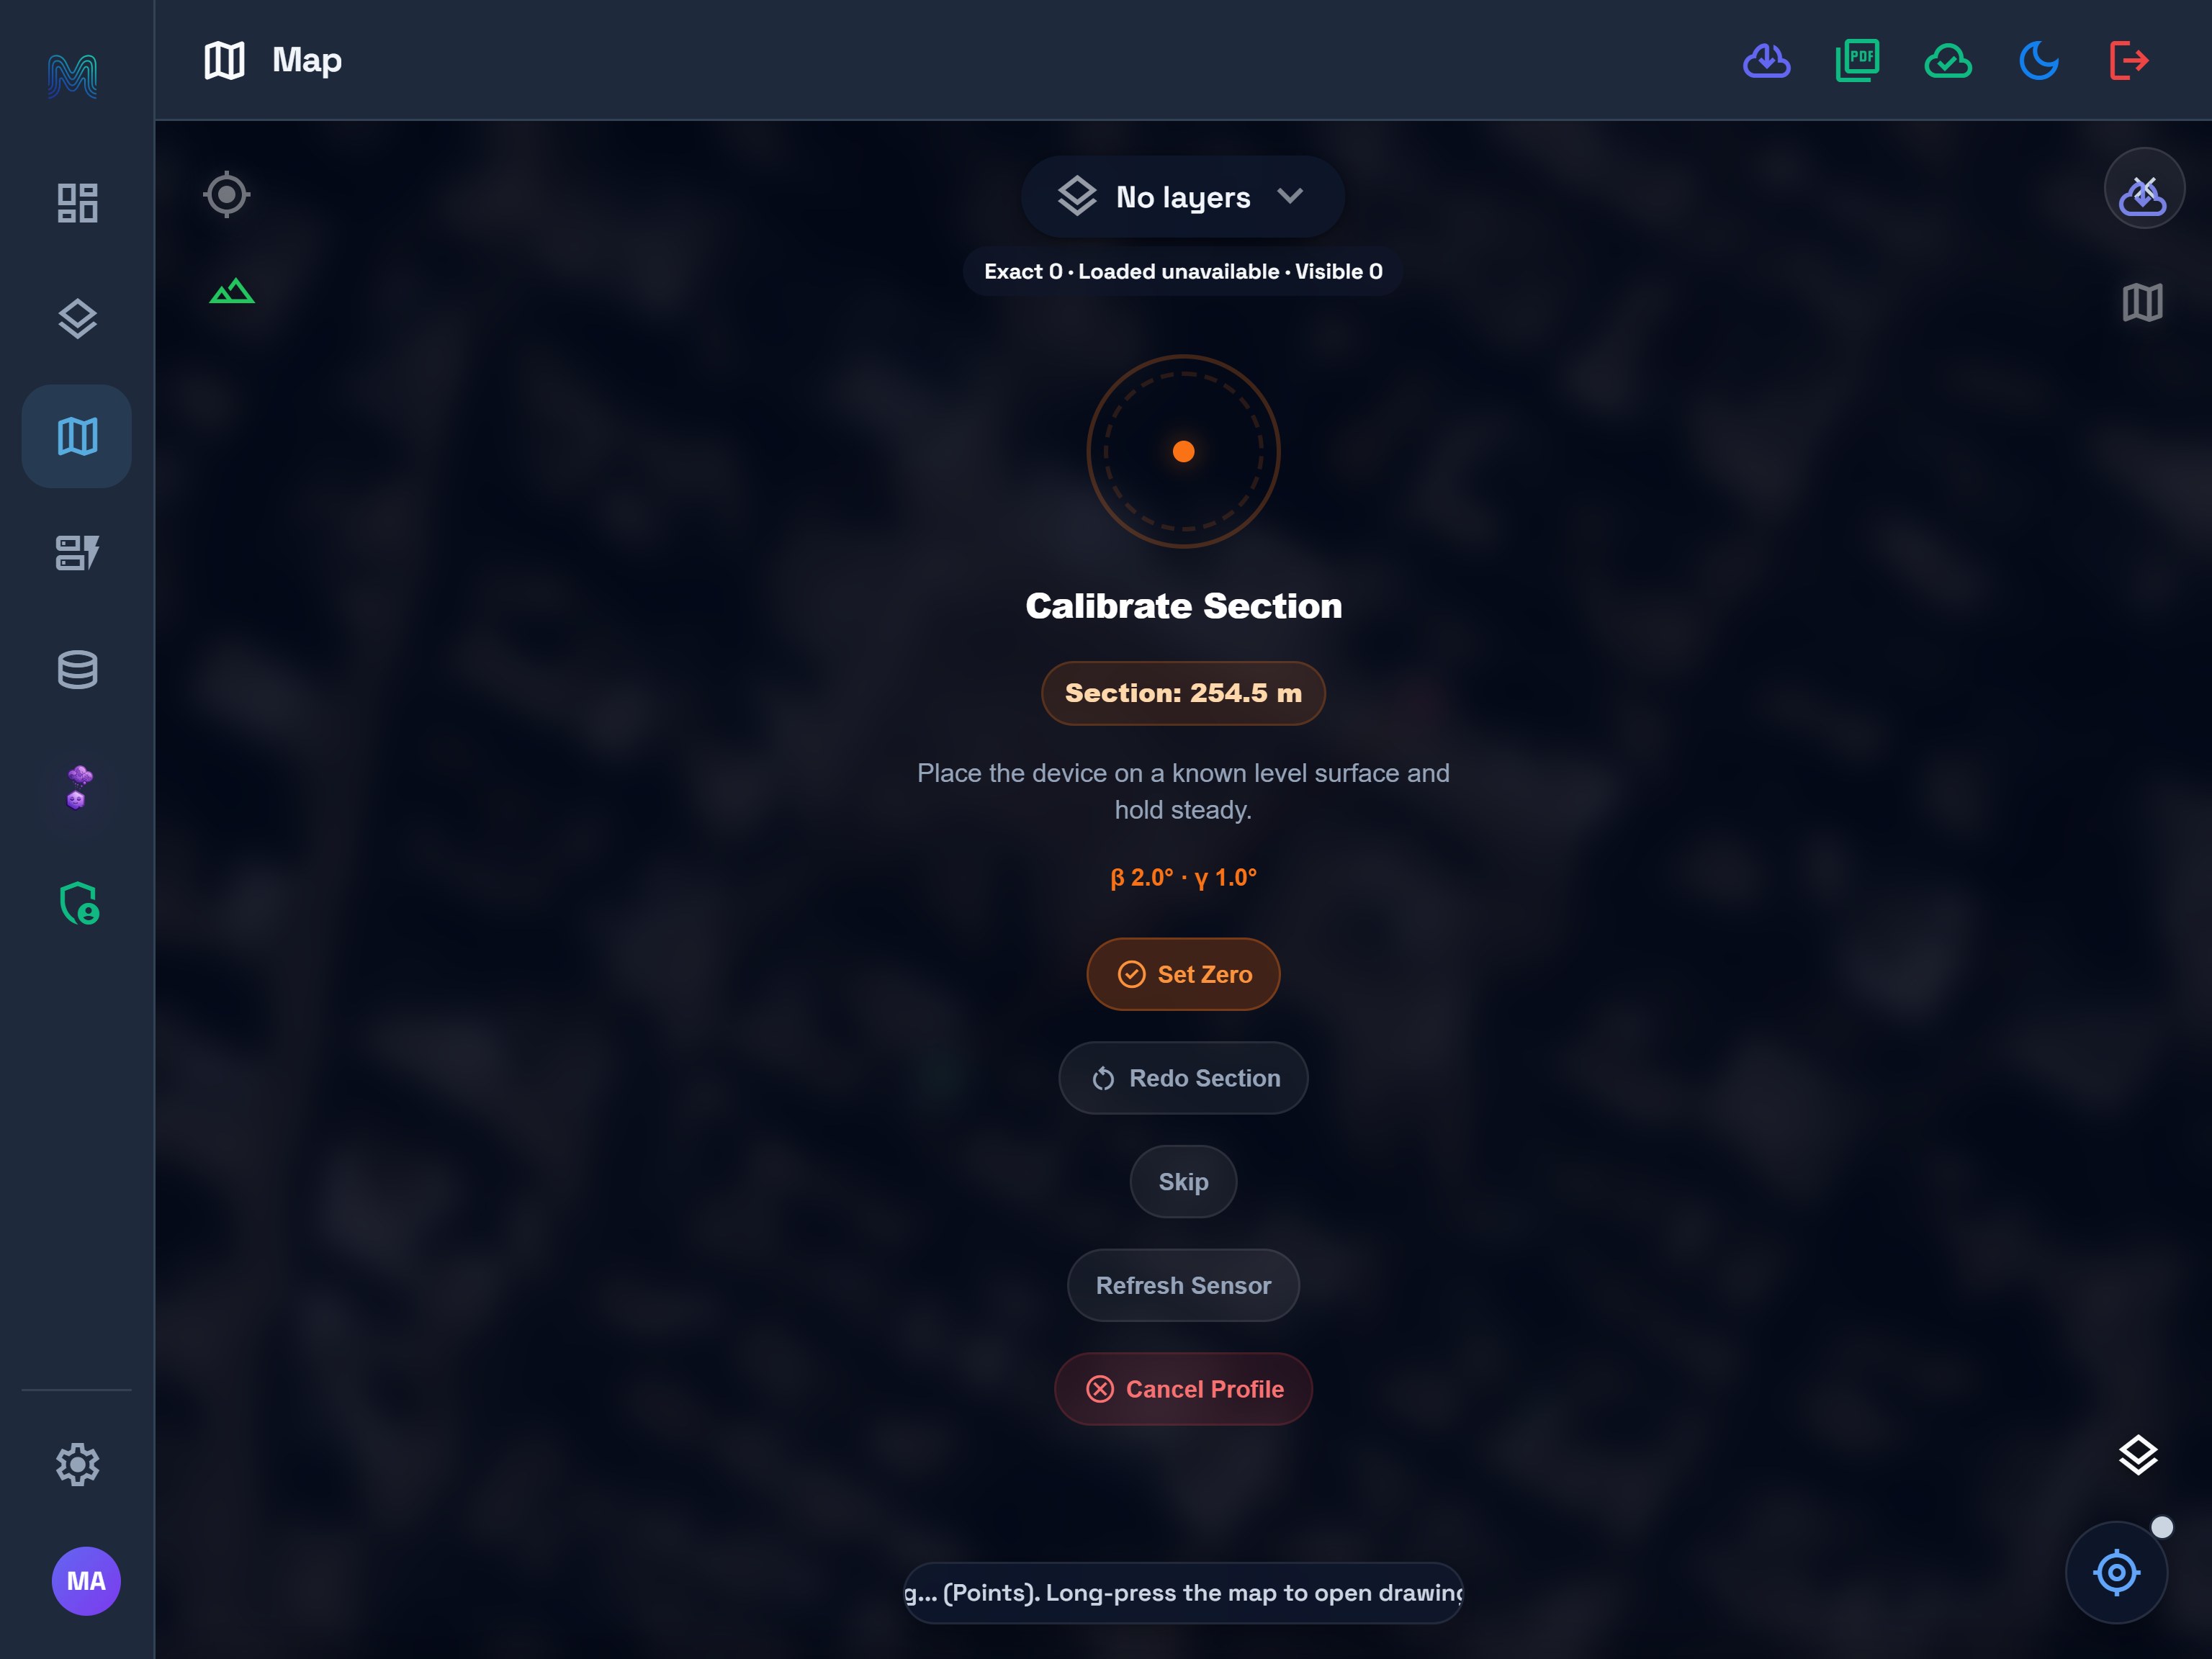
On a real device, gently tilt the phone to check the live values, then place it on a known level reference and hold it still. Choose Set Zero. In this simulation, the baseline input was β 2° / γ 1°; those numbers illustrate an offset, not a target to reproduce. Set Zero refuses missing or expired sensor input; on success, the gauge becomes zero immediately.
See the tablet mode view
3. Record four stations
Set your quality warnings
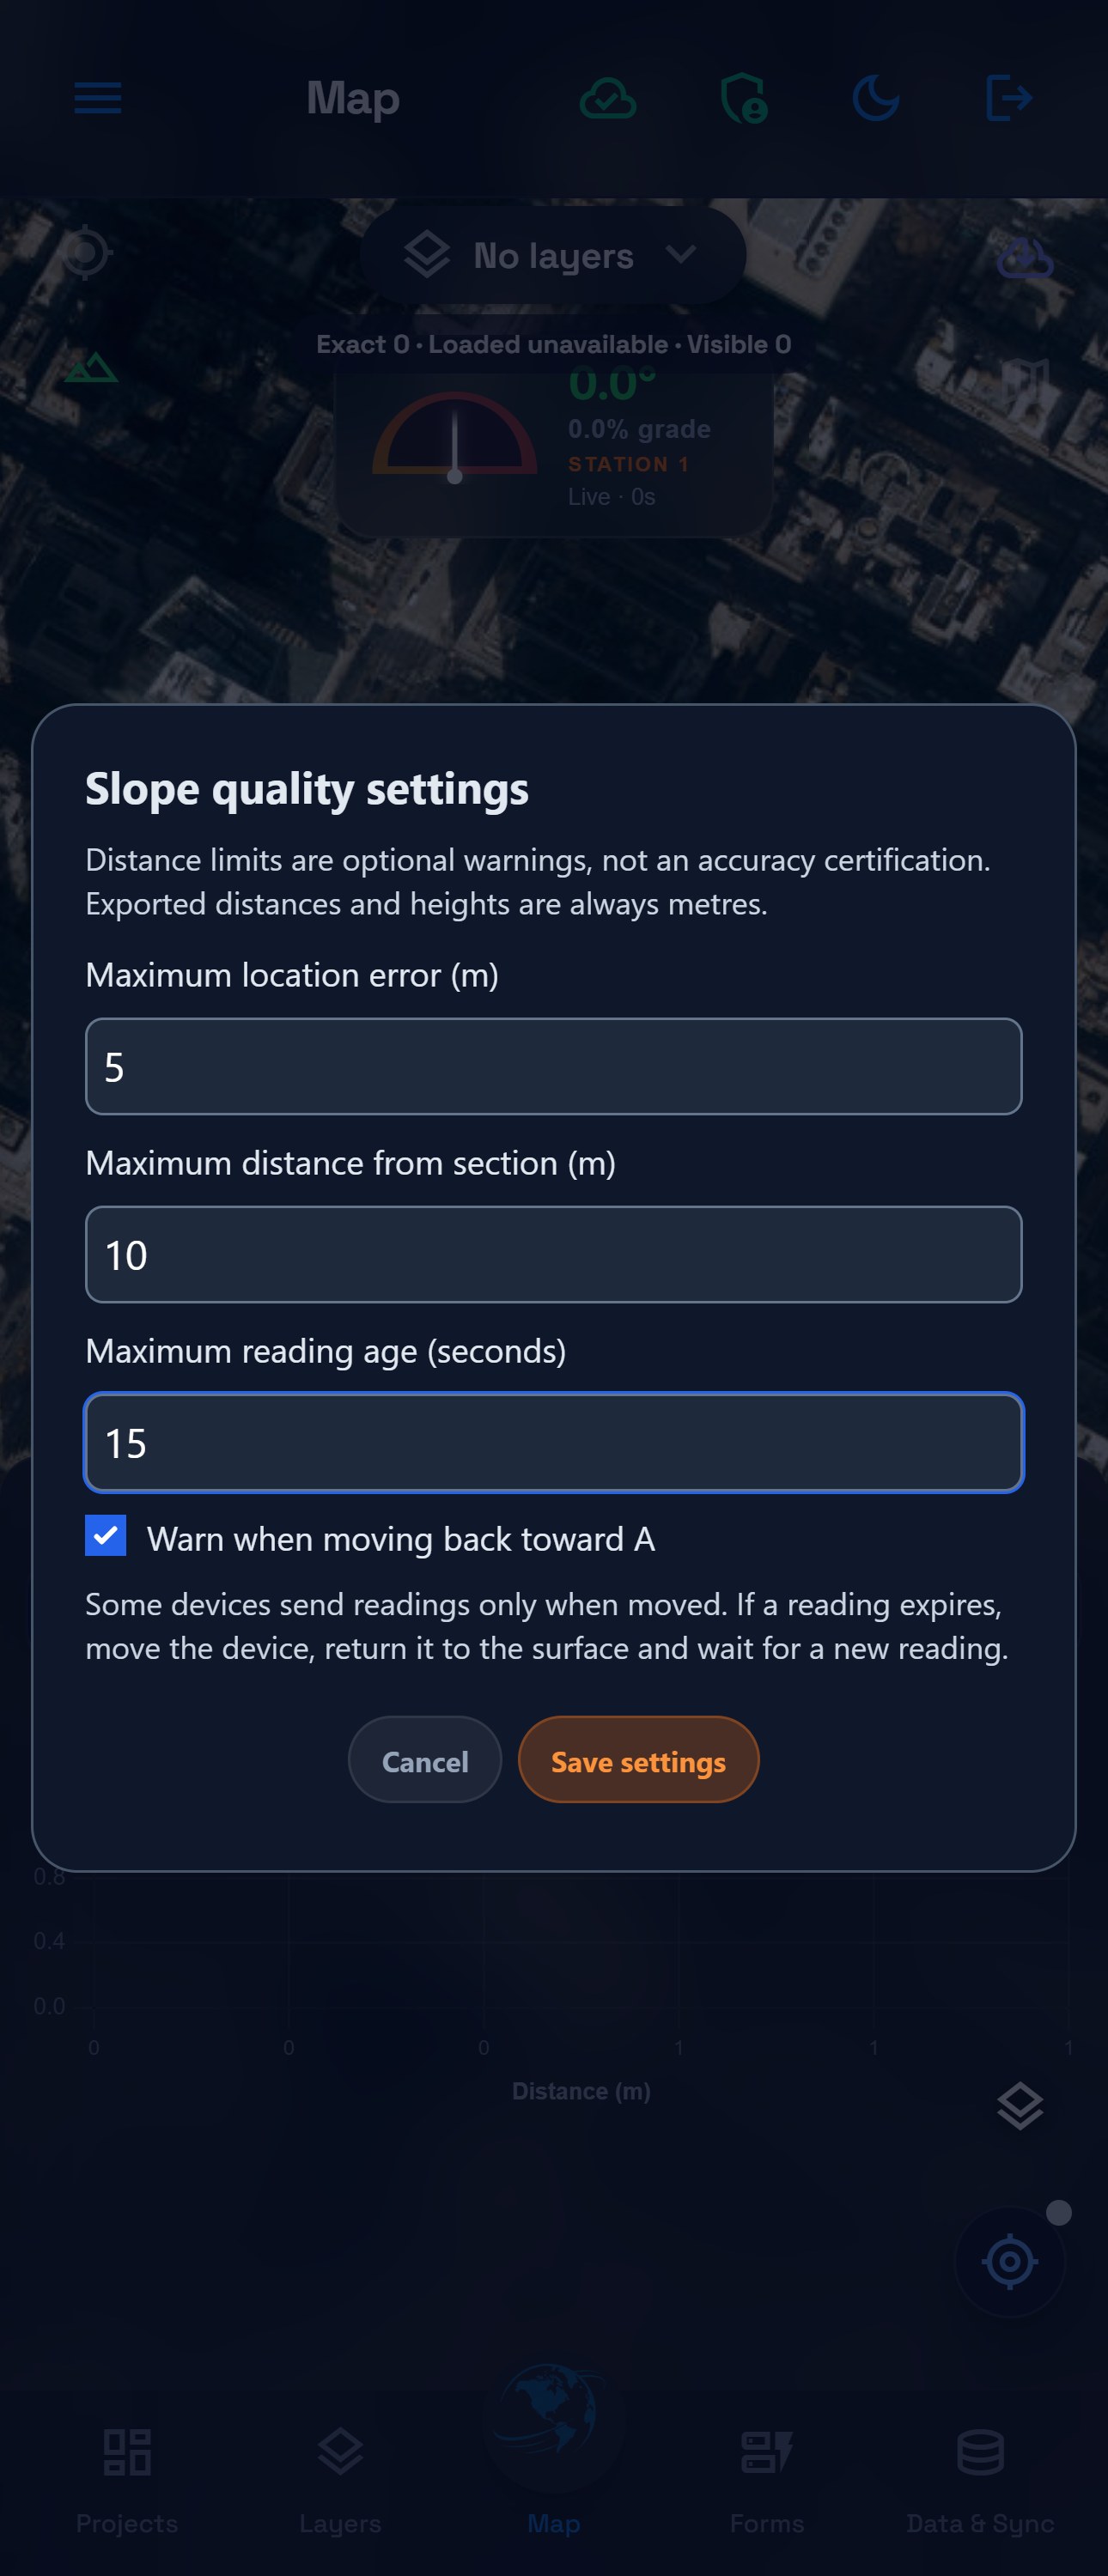
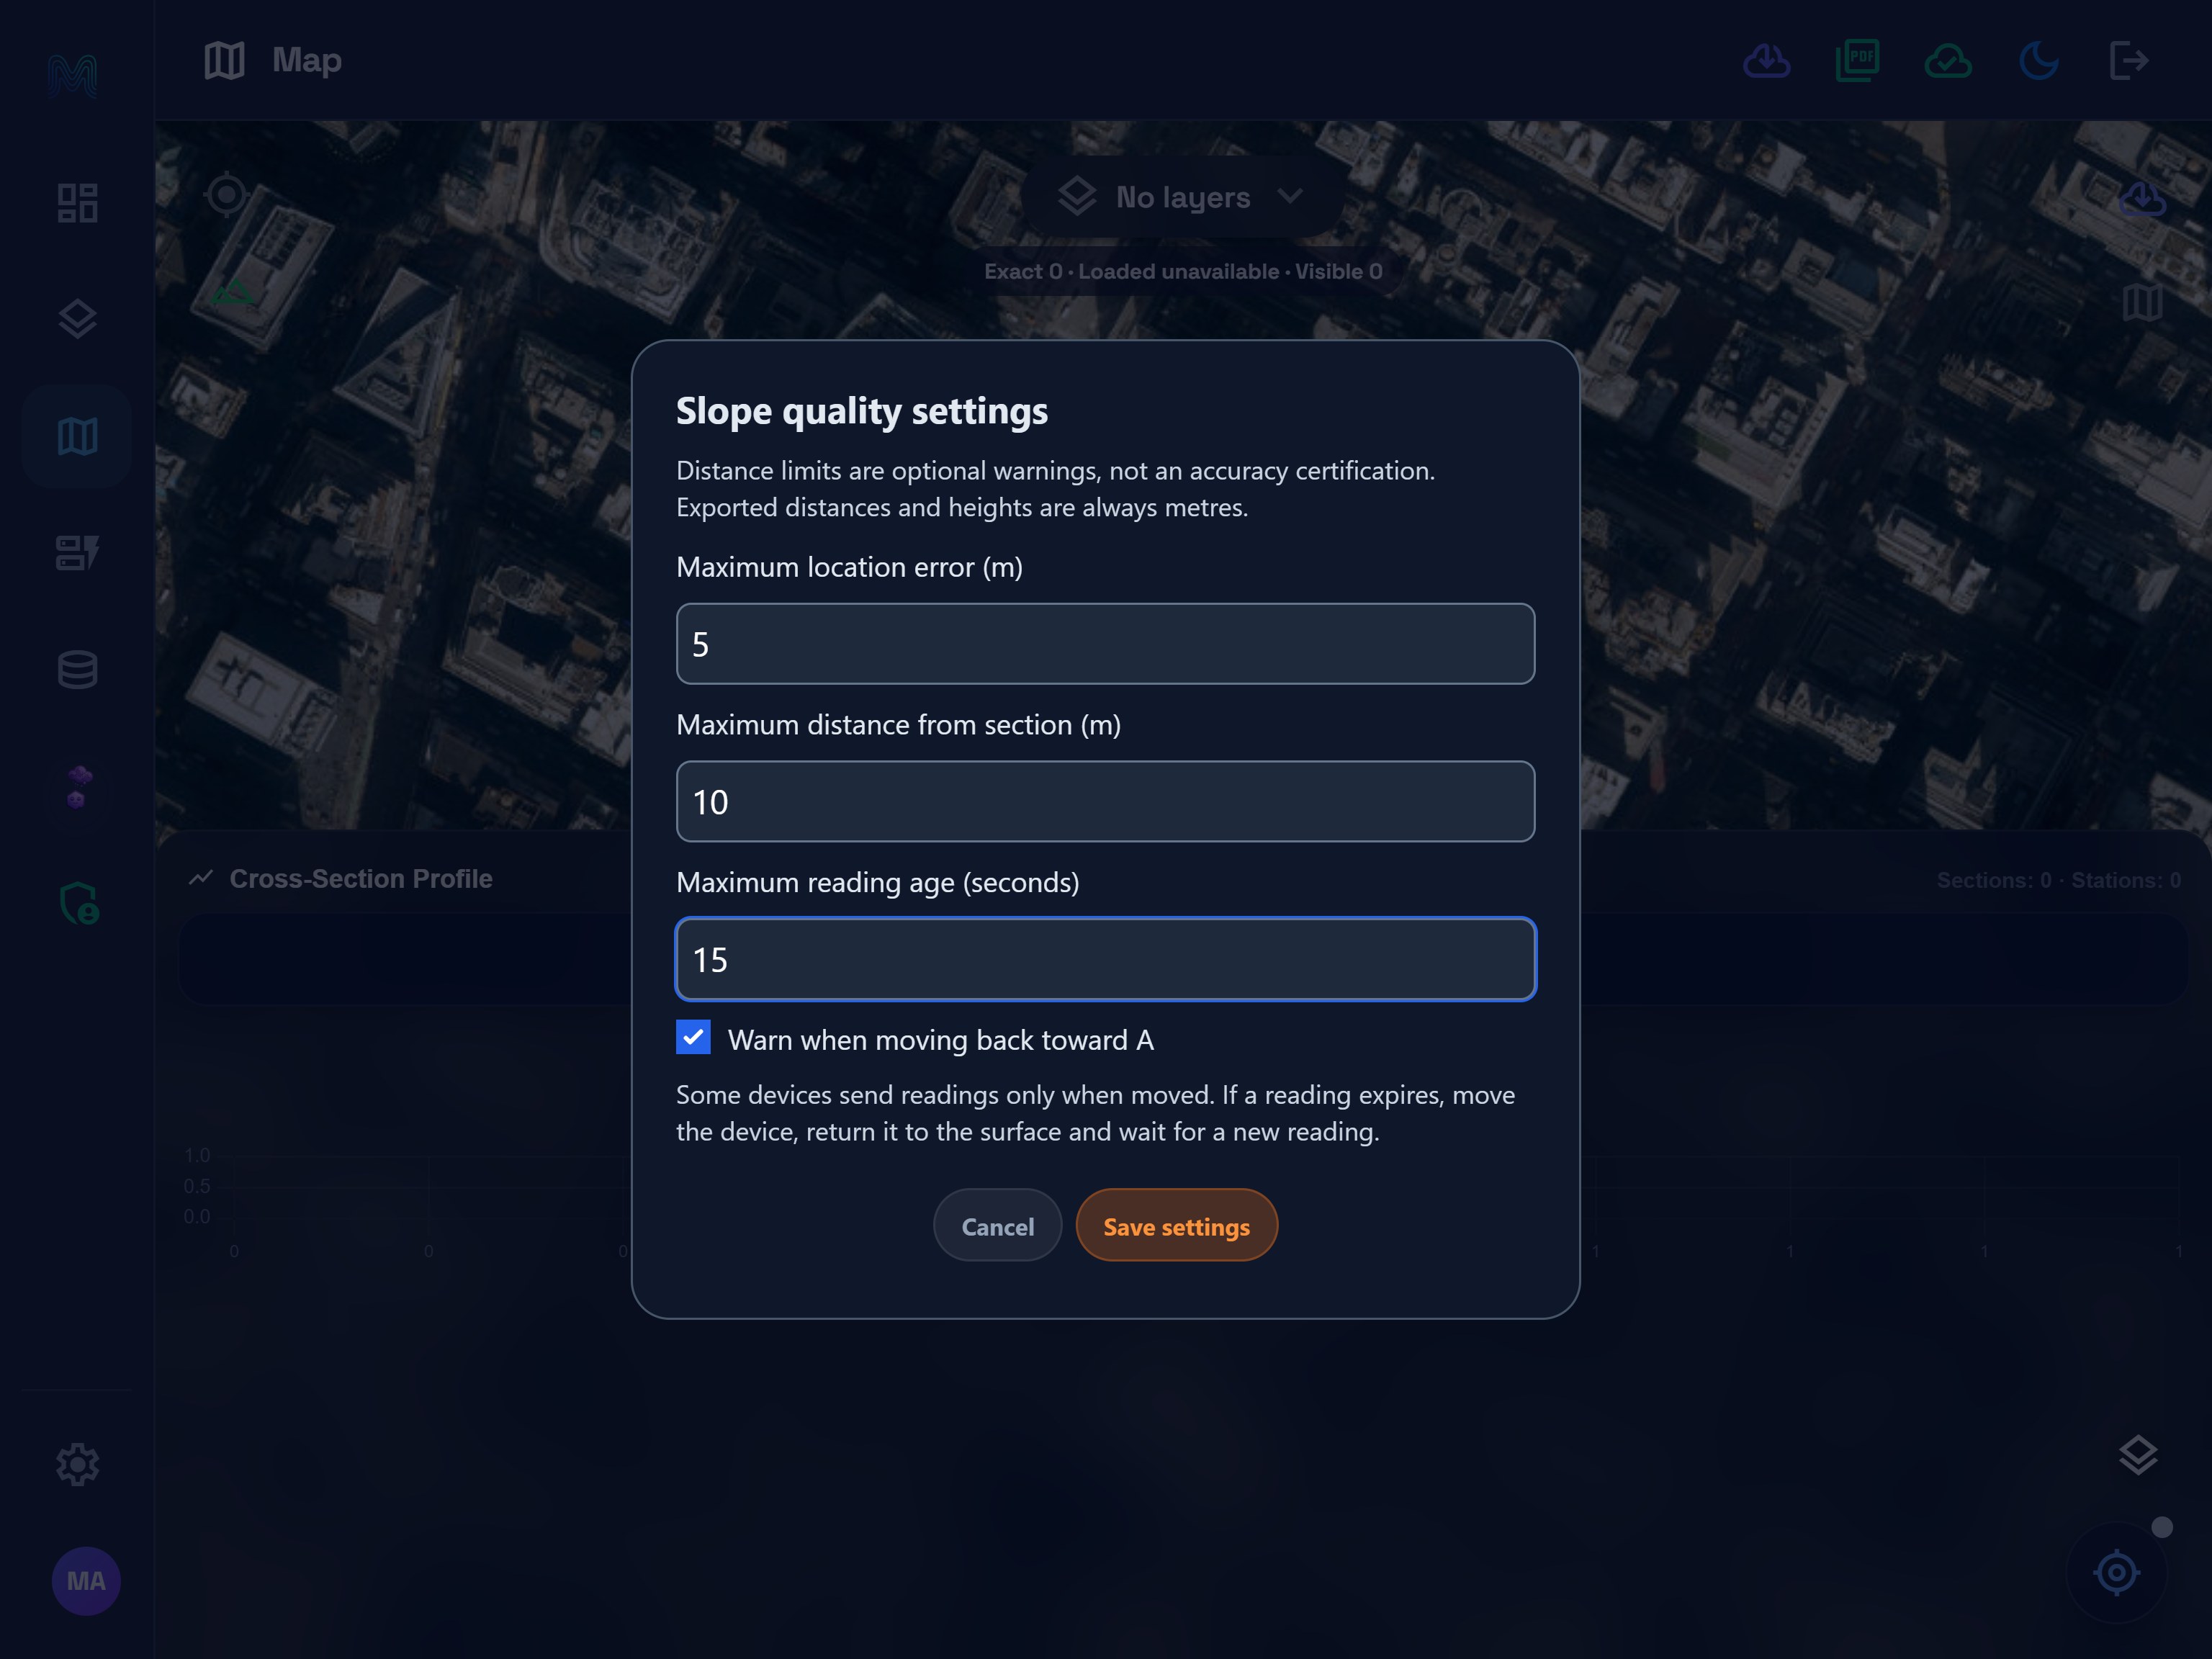
Open Settings in the profile sheet. This exercise uses Maximum location error: 5 m, Maximum distance from section: 10 m, and Maximum reading age: 15 seconds, with the backtracking warning on. These are fictional practice choices, not recommended survey tolerances. Both distance limits are optional and default to blank; choose limits suited to your own task.
See the tablet mode view
Place and record the stations
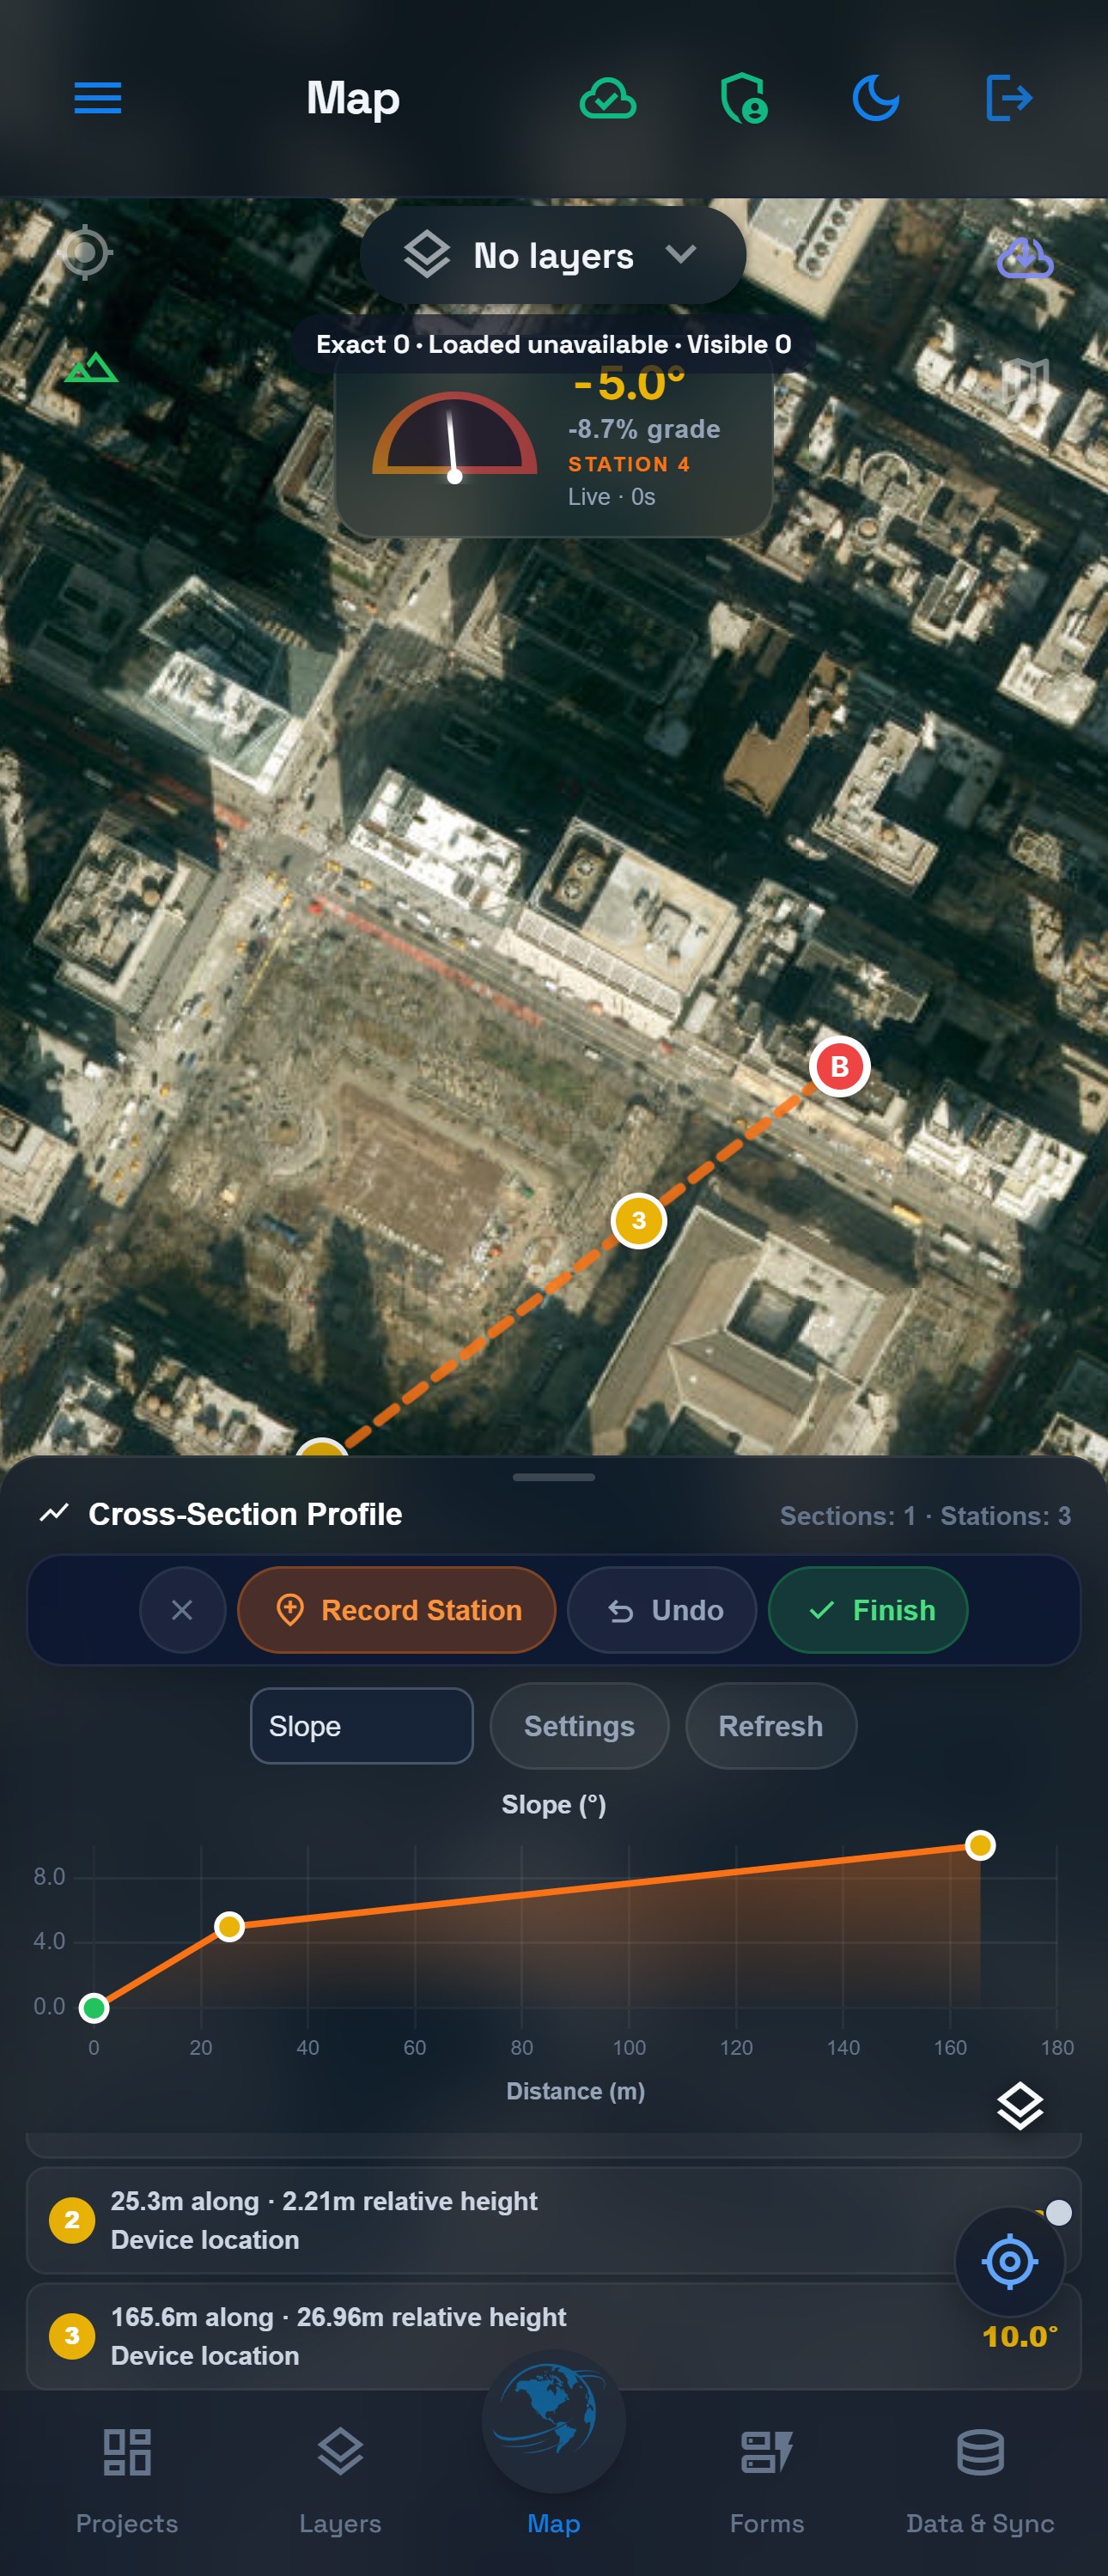
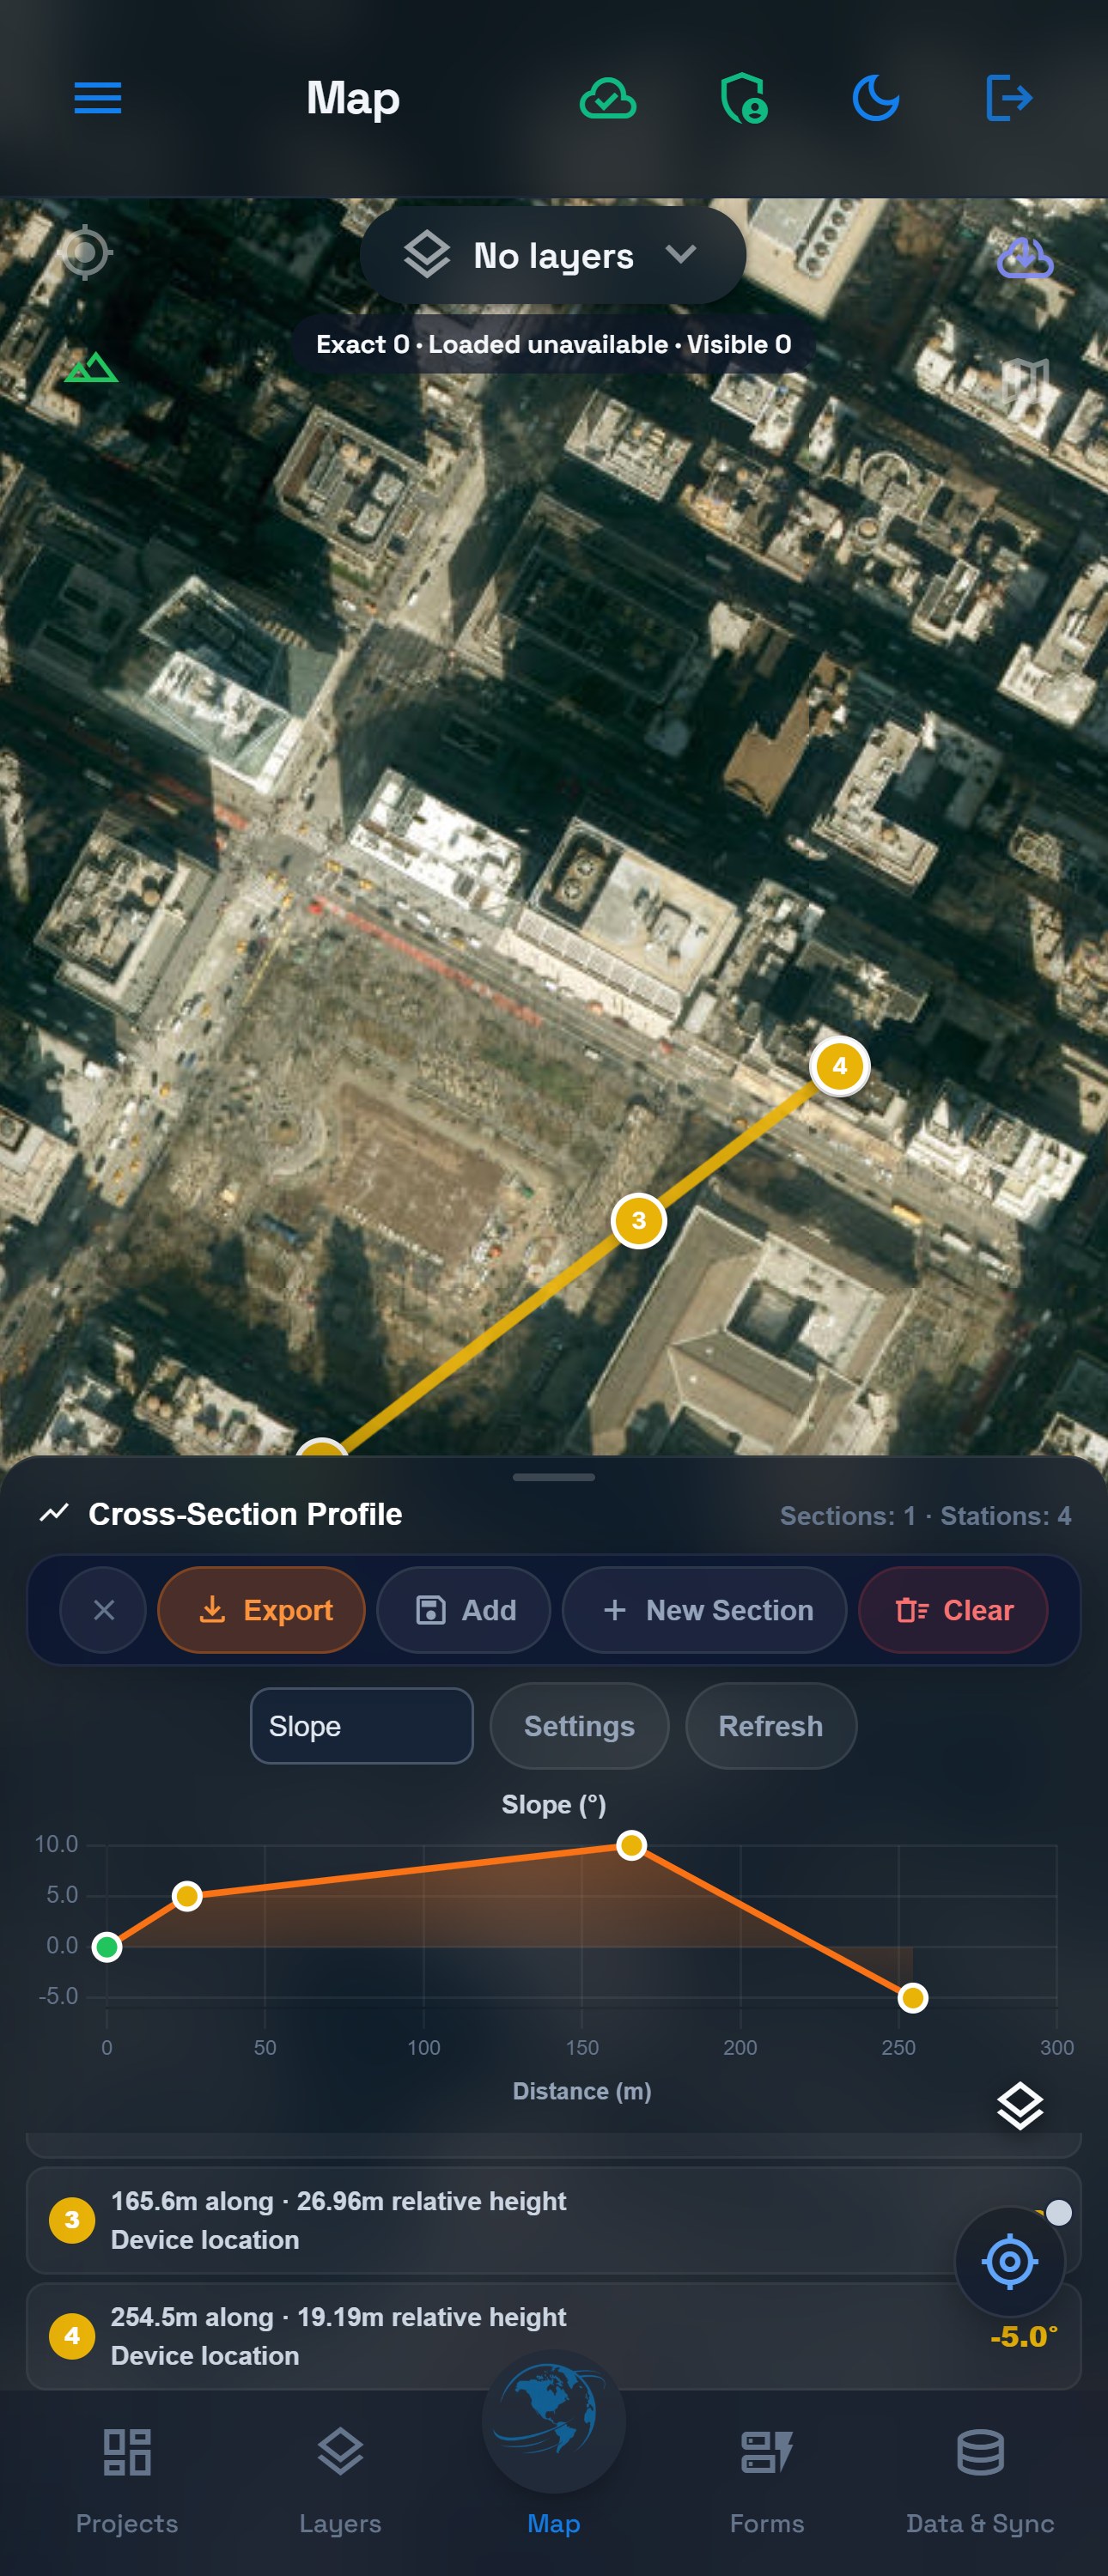
Move along the line from A toward B. Keep the phone aligned with the surface and the same direction, wait for a stable reading, and choose Record Station. Wait for the station to appear before continuing. The example uses four simulated positions and signed slopes of 0°, 5°, 10° and −5°.
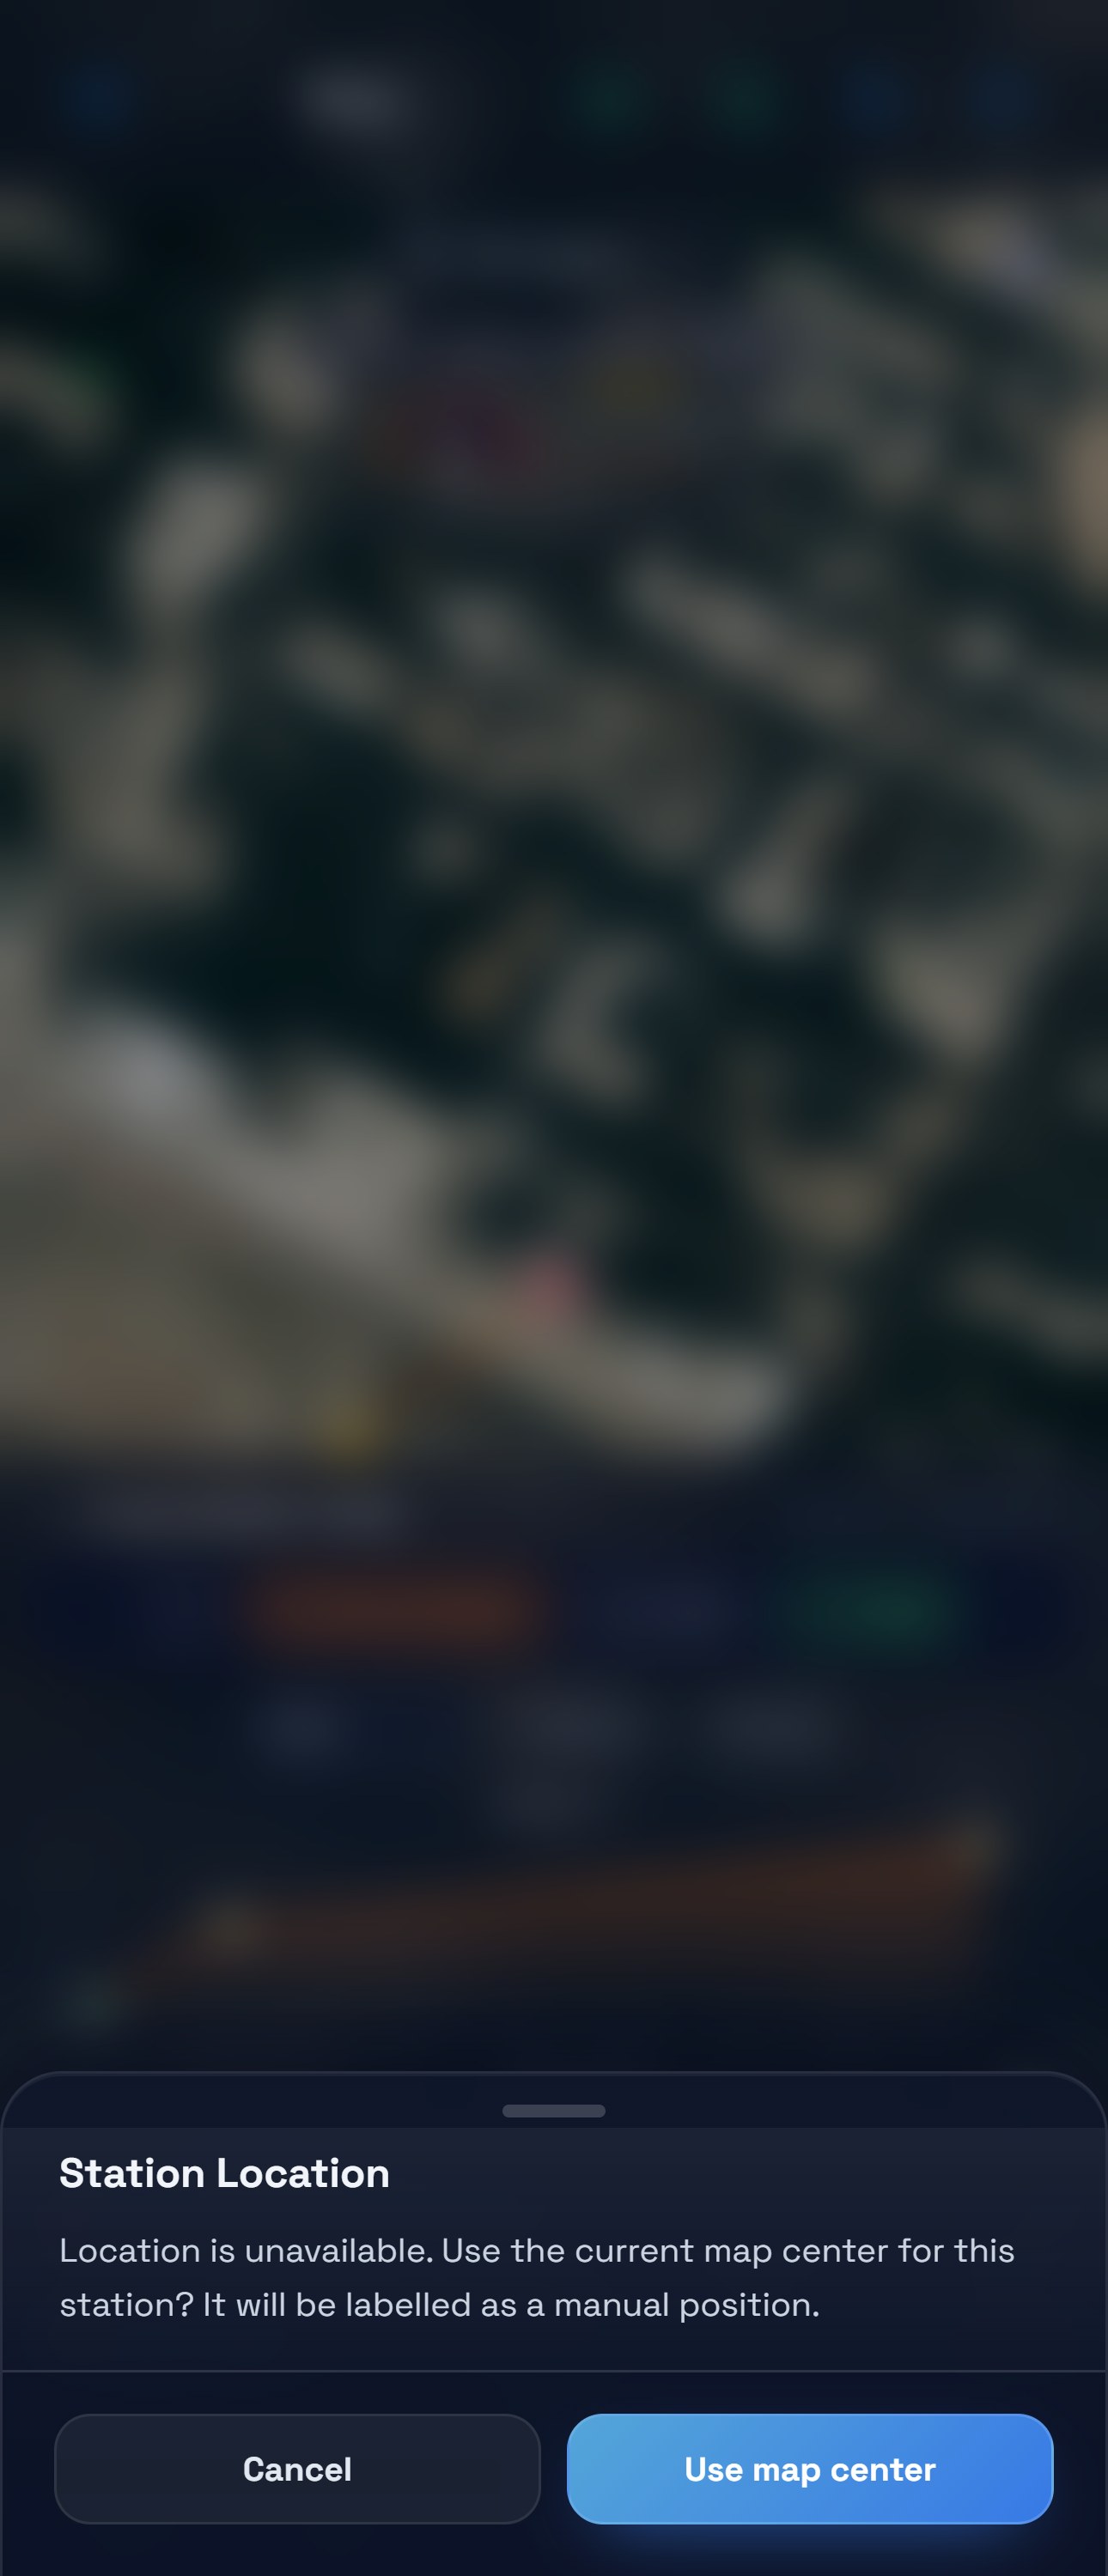
Check each station's distance and placement. The app projects the acquired position onto the drawn line. If location fails, it asks before using the map center and labels an accepted fallback as manual. Do not accept a station merely because it appears on the baseline.
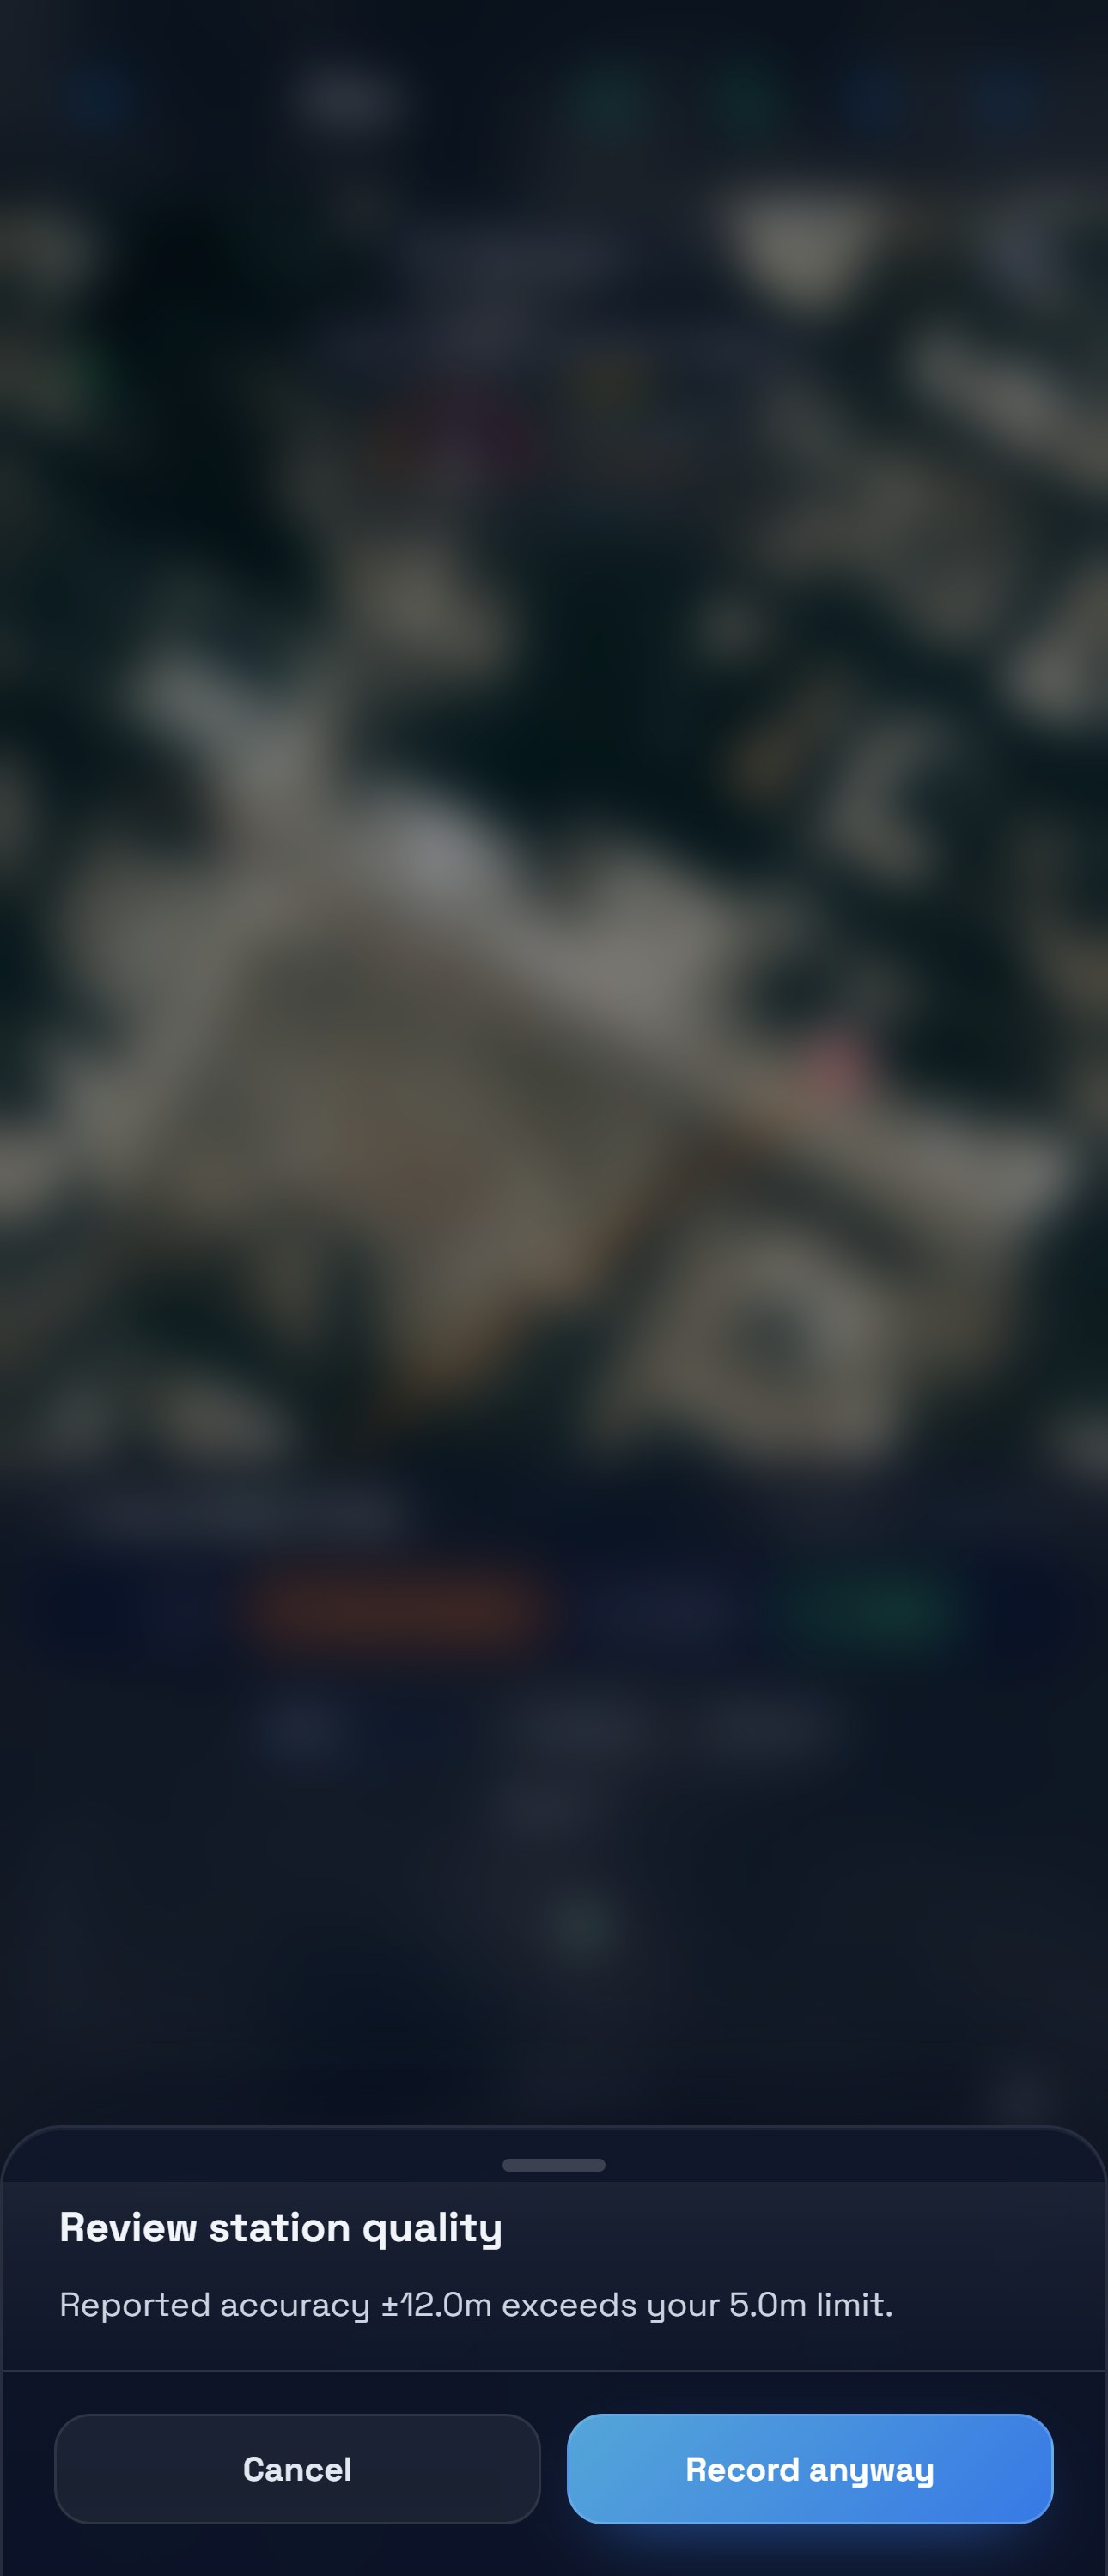
A simulated accuracy of ±12 m triggers the 5 m limit. Choose Cancel and check that no station was added, then try again with a checked location. Record anyway accepts the observation and retains its quality flags. The phone example cancels this warning and repeats with simulated ±3 m input.
Decide what to do when location is unavailable
A failed location request opens Station Location. In the phone example, choose Cancel, then retry with available device-location input. The tablet example accepts a manual map-center position for its final station and explicitly accepts the unknown-accuracy warning. Both paths are simulated.
Confirm the location and quality separately
When Use map center opens Review station quality, the second dialog remains open until you decide. Choose Record anyway to add one station or Cancel to leave the station count unchanged. The mobile and tablet flows use the same separate decisions.
Use Undo if the latest station is wrong, then record it again. Undo removes the latest recorded station and invalidates an in-flight station capture. Finish also checks that the session is still current before completing it. After at least two stations, Finish completes the section. This example finishes with four.
4. Read the profile correctly
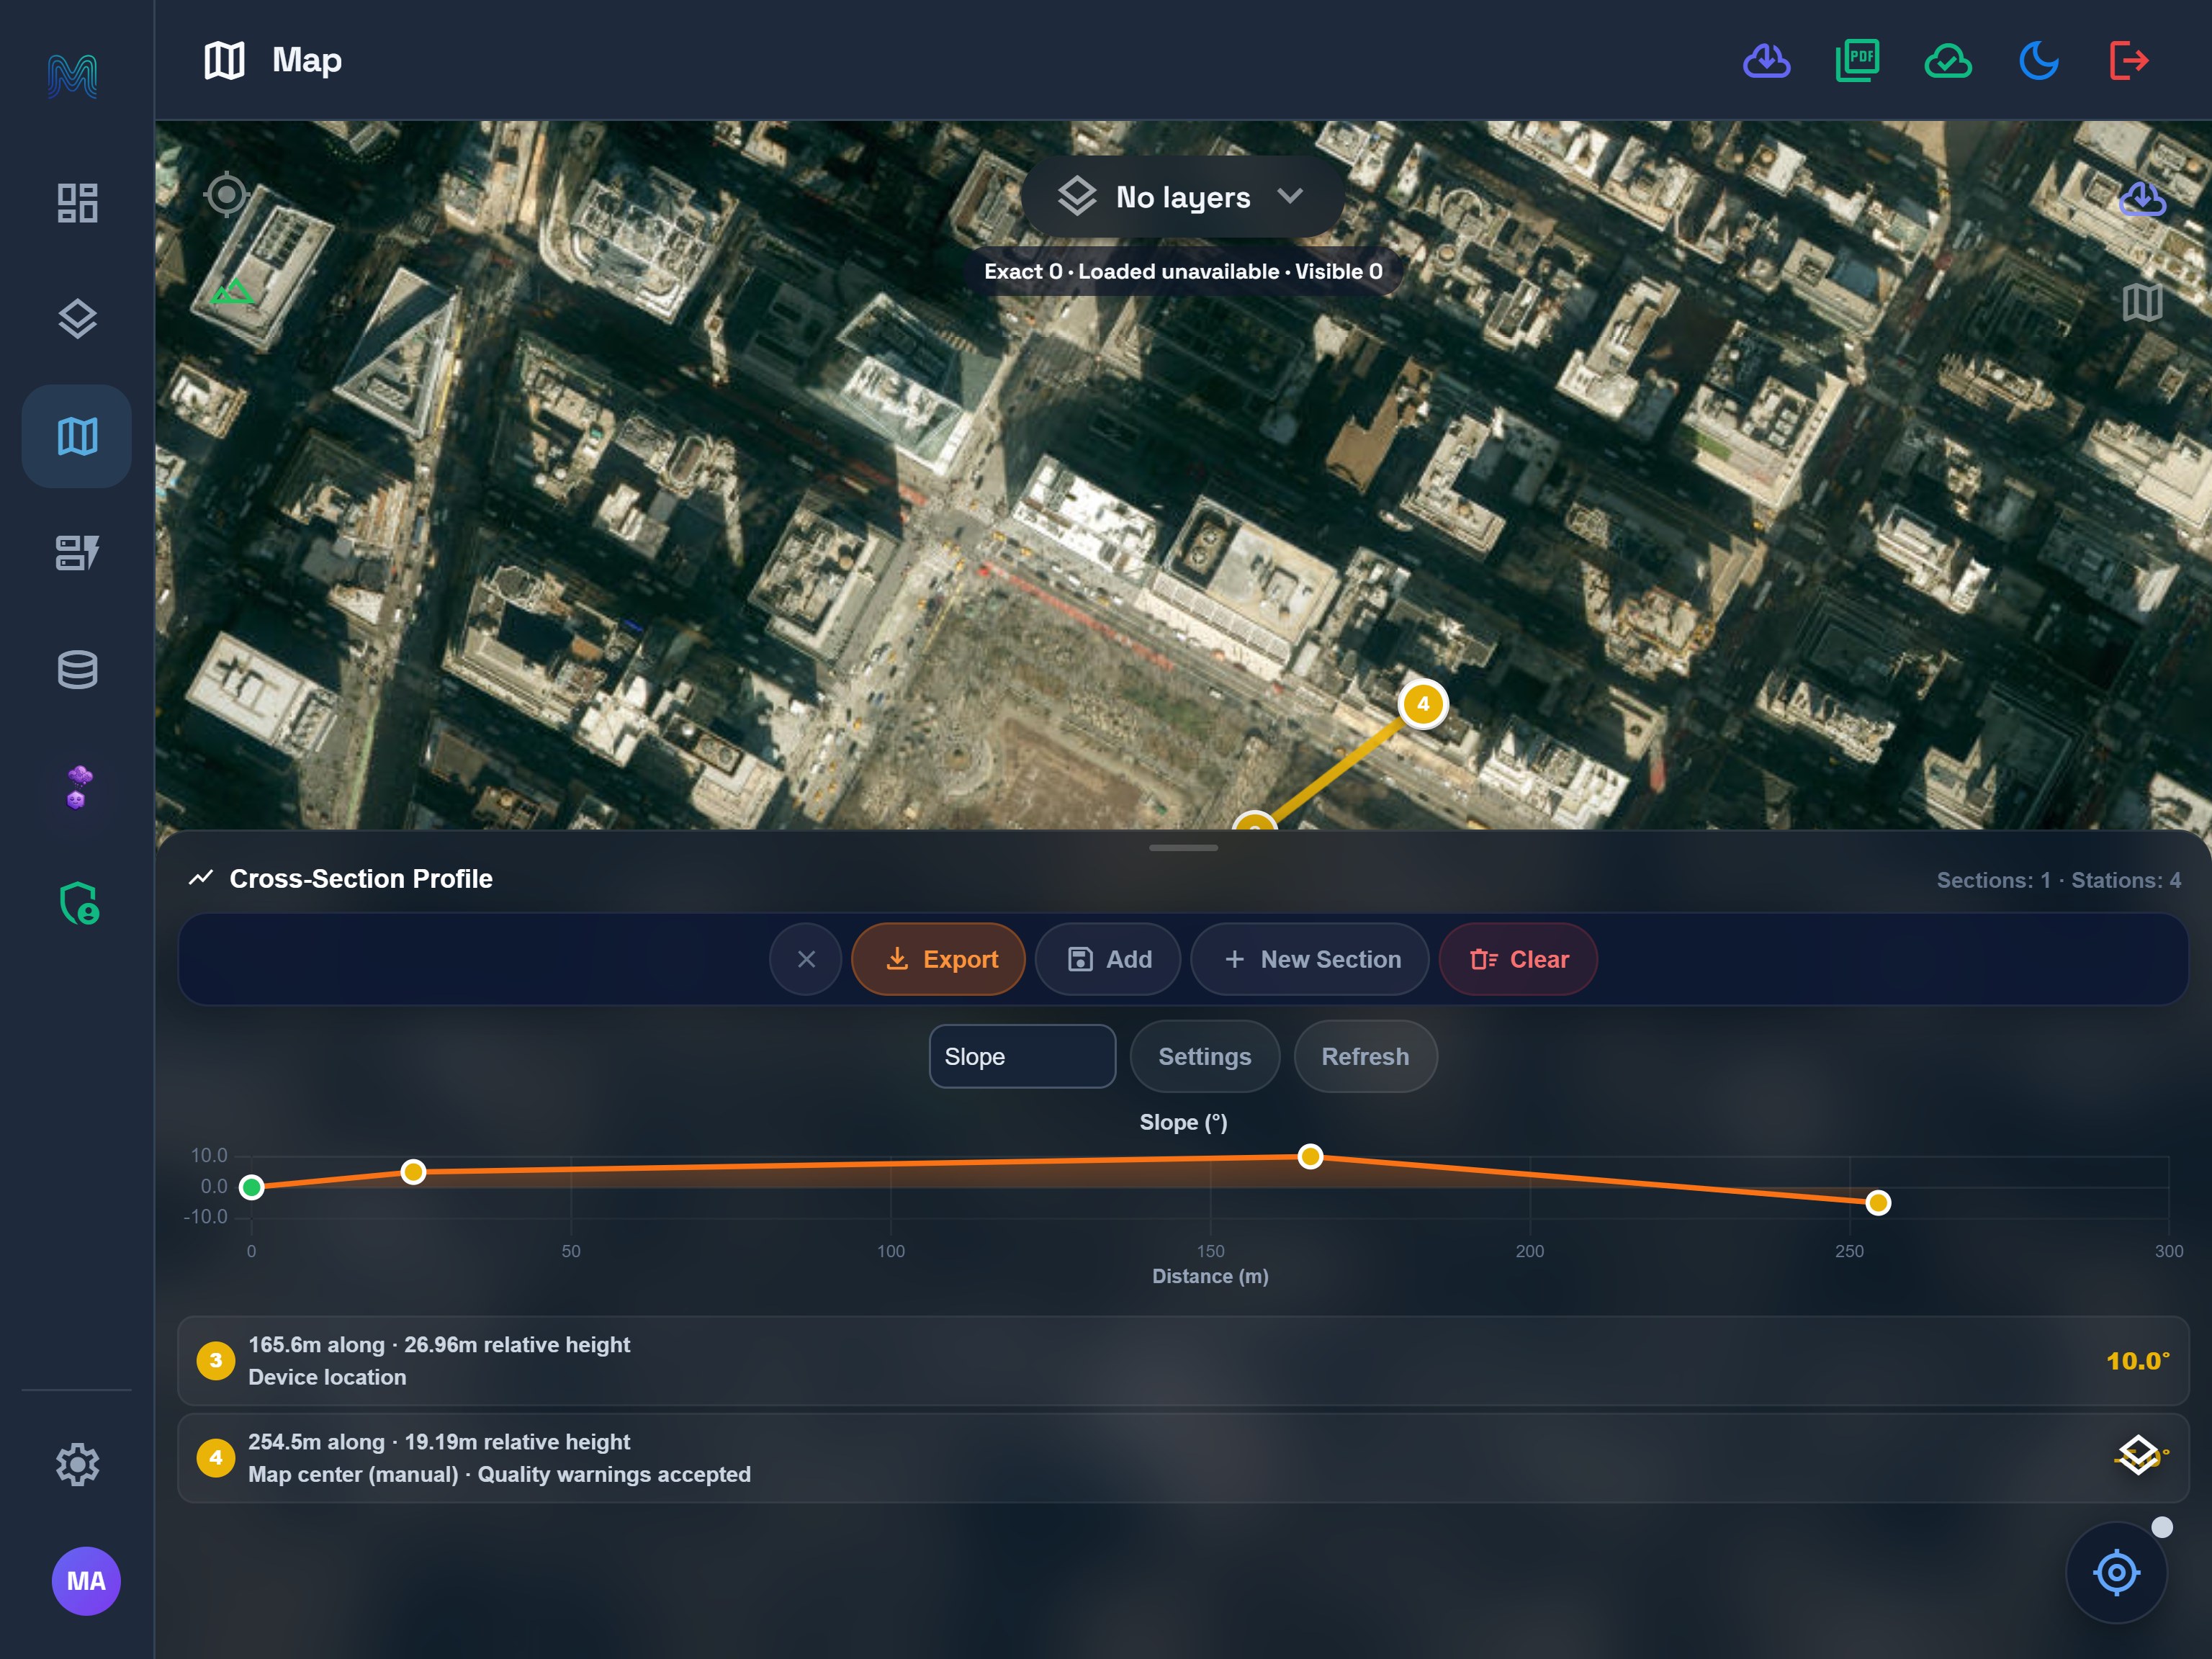
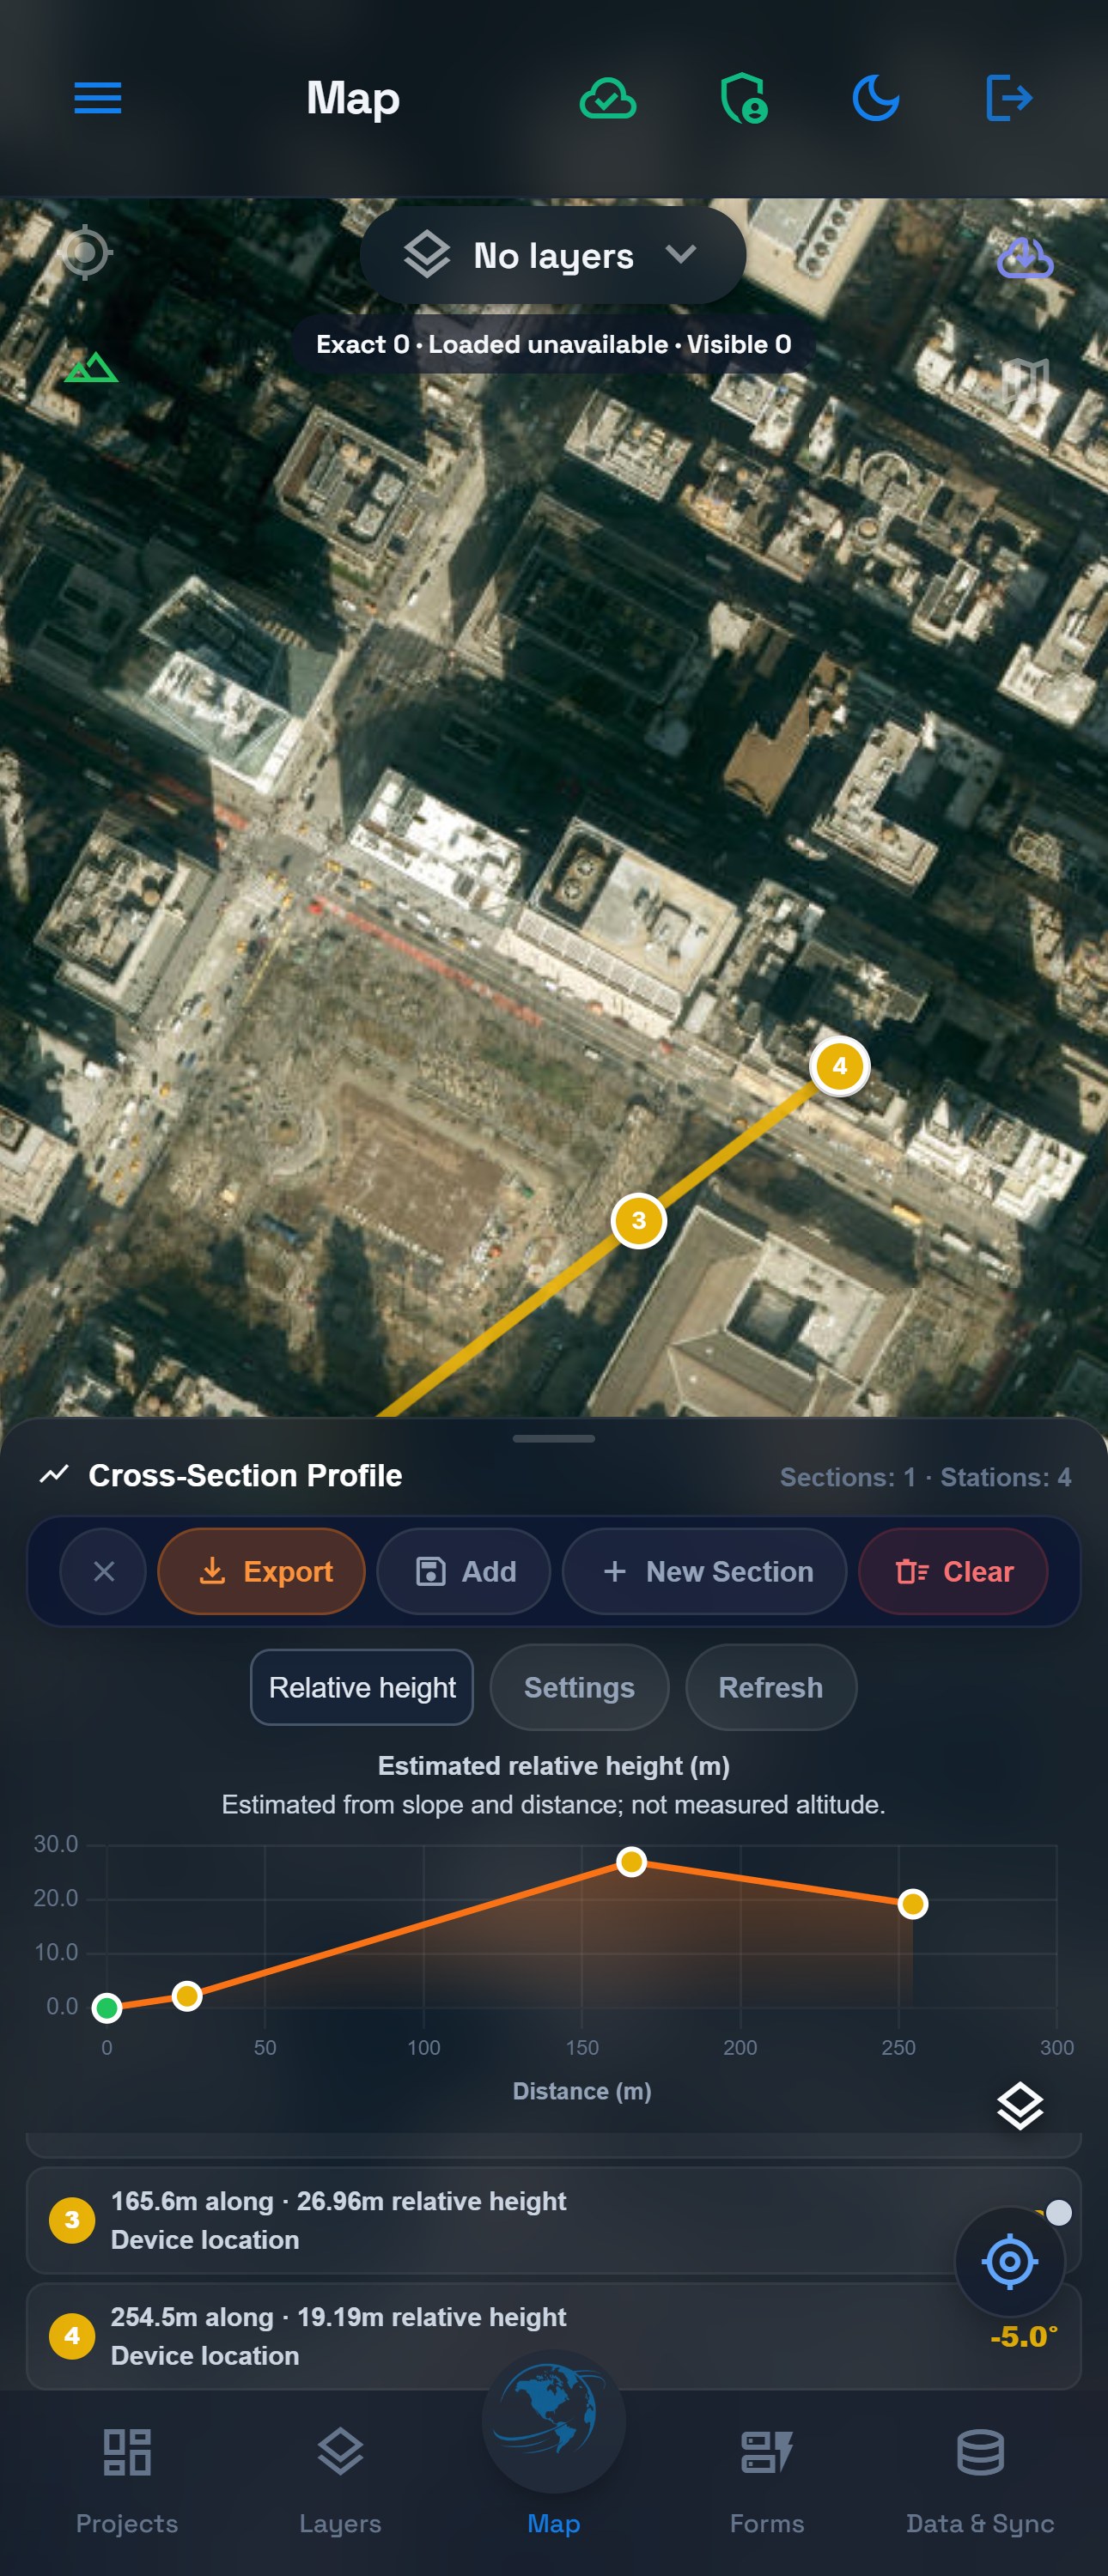
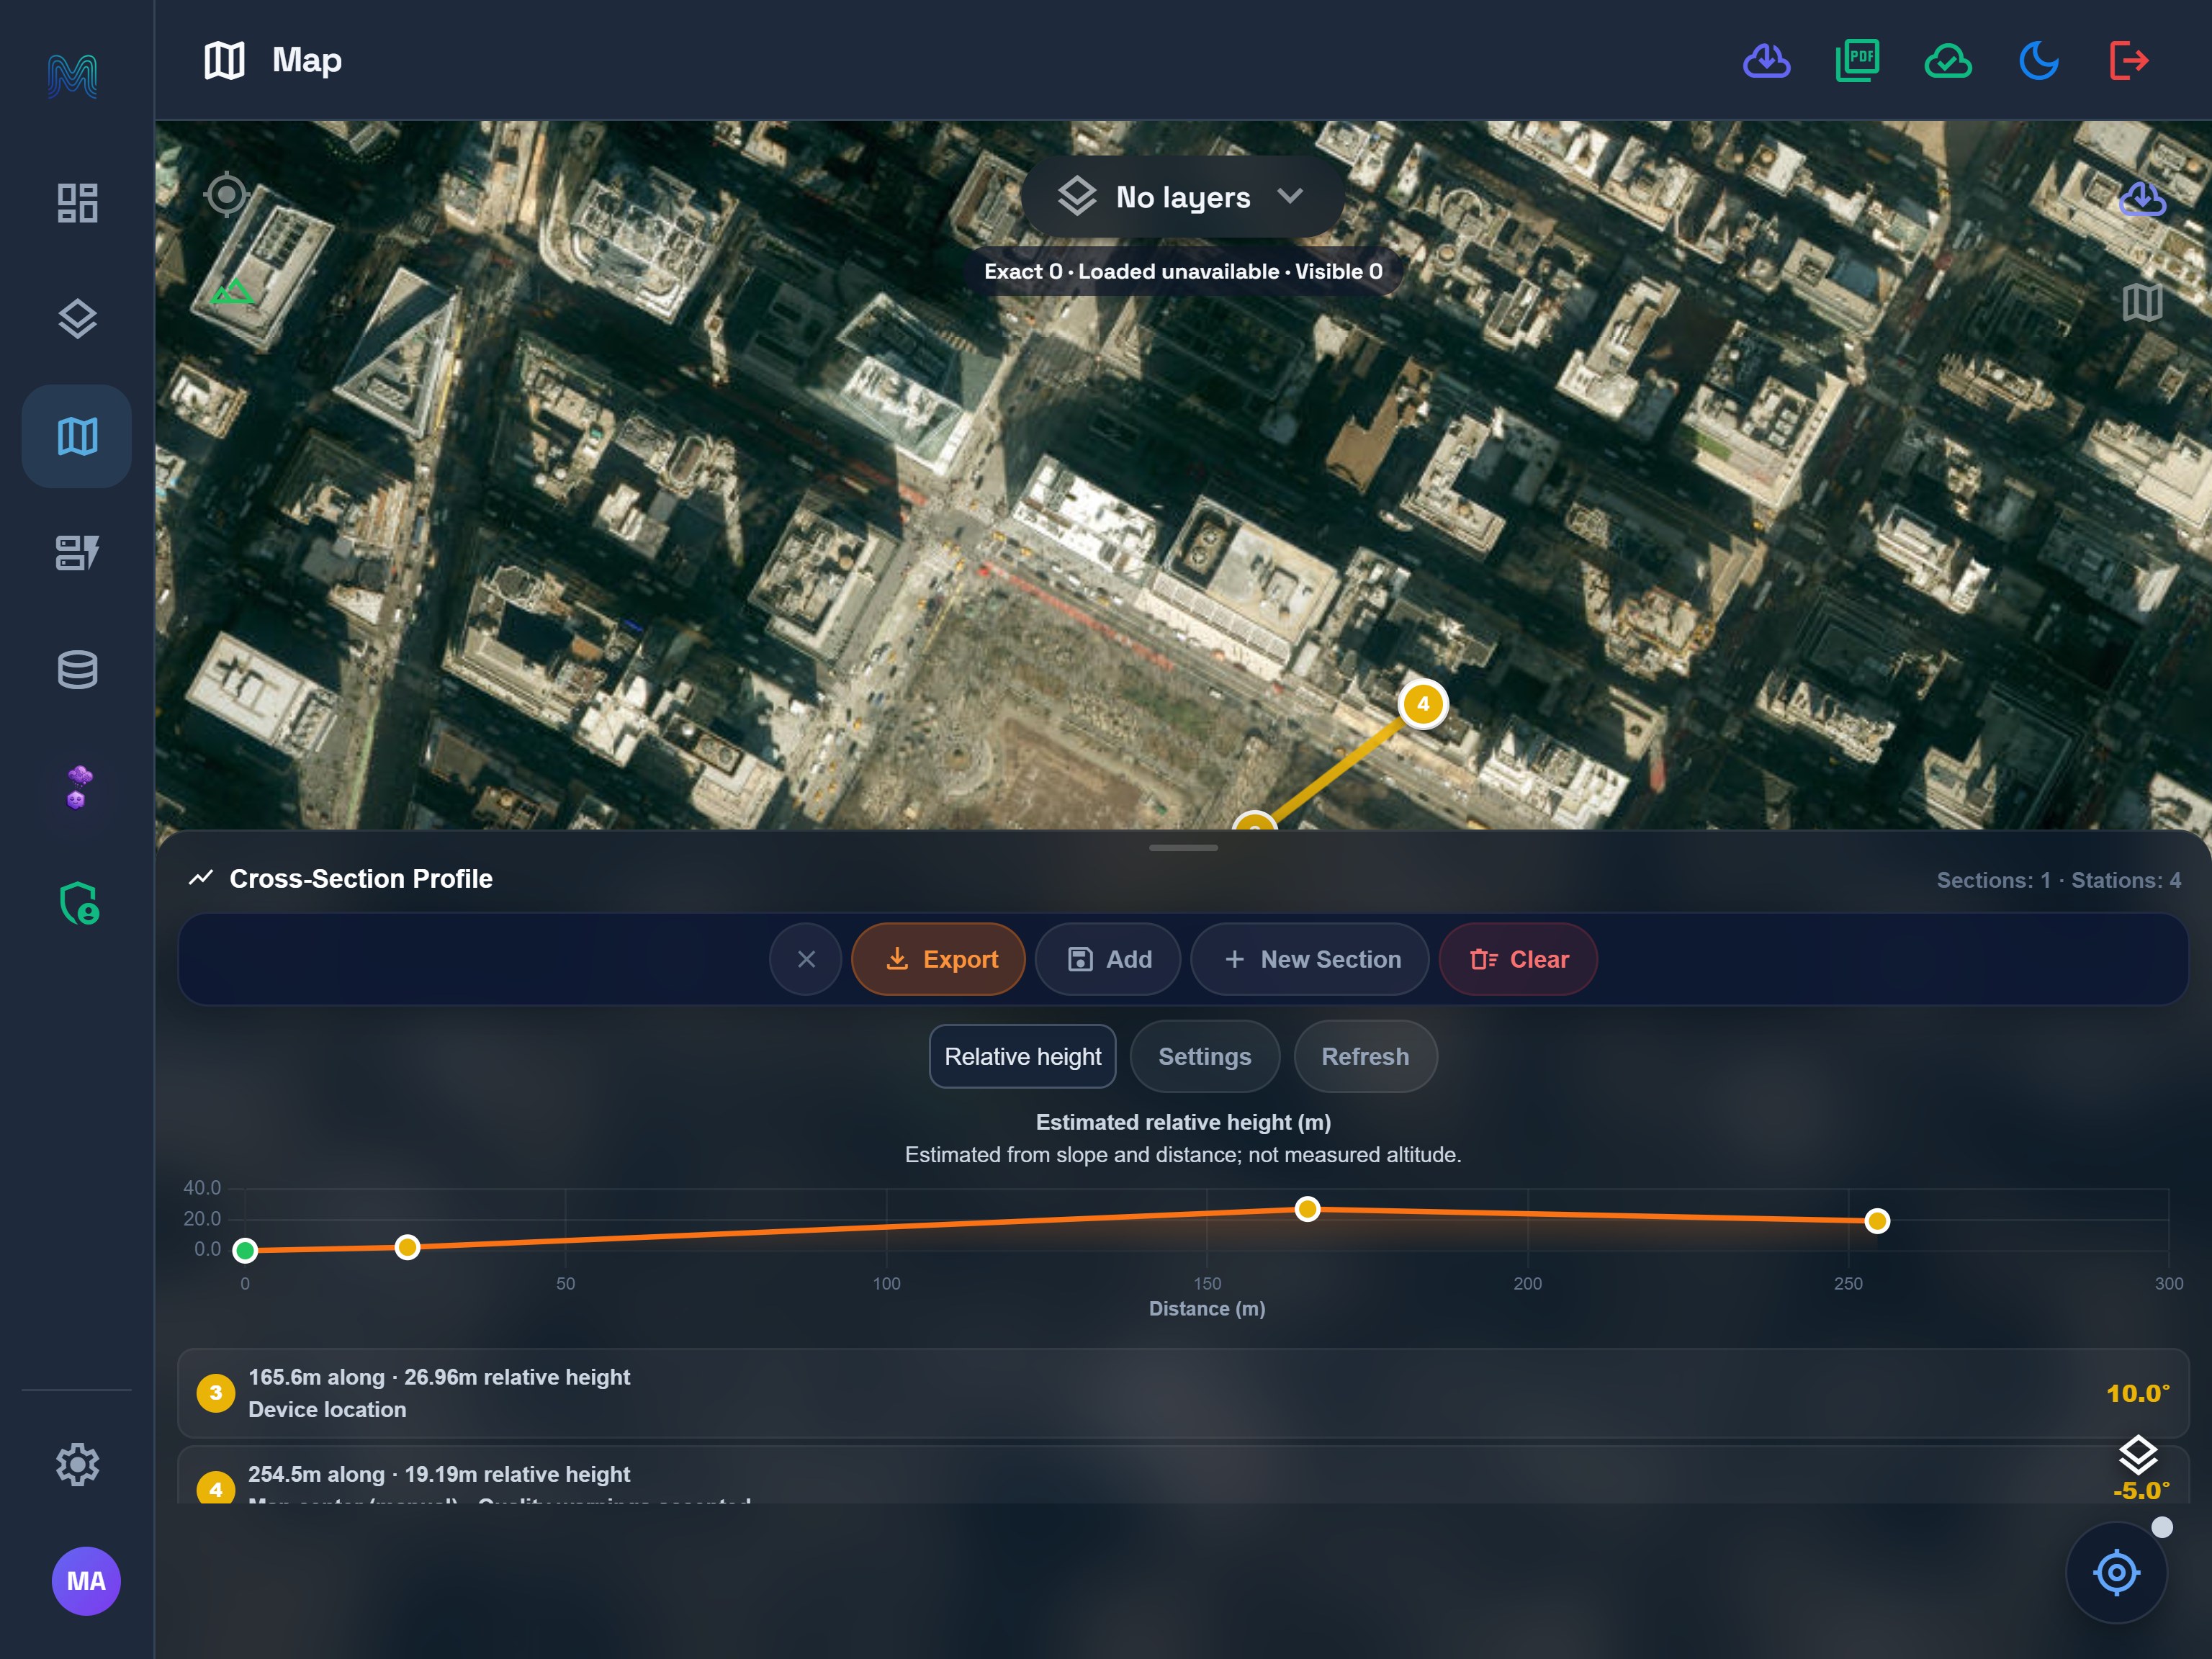
The default chart plots signed slope angle against actual numeric distance. A falling segment means the next recorded angle is lower. Choose Relative height in the selector to show Estimated relative height (m). This is a slope-and-distance estimate, not measured altitude. The stations in this refreshed example are deliberately unevenly spaced: about 0%, 10%, 65% and 100% along the section.
See the tablet mode view
See the tablet mode view
The refreshed phone export contains:
| Station | Distance (m) | Signed slope | Grade | Calculated relative height (m) |
|---|---|---|---|---|
| 1 | 0.00 | 0° | 0.00% | 0.000 |
| 2 | 25.32 | 5° | 8.75% | 2.215 |
| 3 | 165.65 | 10° | 17.63% | 26.959 |
| 4 | 254.48 | -5° | -8.75% | 19.188 |
The last negative reading is retained in the station and export; the live gauge also retains the sign. Relative height is calculated from angle and distance changes with a zero reference. It is not measured altitude and does not describe the actual New York terrain.
5. Export the measurements
Choose Export to obtain GeoJSON. For this one-section example, the file has one LineString + four Points = five features. Inspect distance_m, slope_deg, slope_pct and elevation_m in the station properties; the last property means calculated relative height here.
Download the verified simulated profile. This refreshed file preserves the phone run and its location-source, freshness and quality-threshold properties; it is a worked example, not a project installer or measured survey. The app's original export filename includes the project identifier and a timestamp.
If you record further sections, export can include them too. Compare the file's section and station counts with your session, rather than assuming the chart represents the entire download.
6. Add it to the practice project
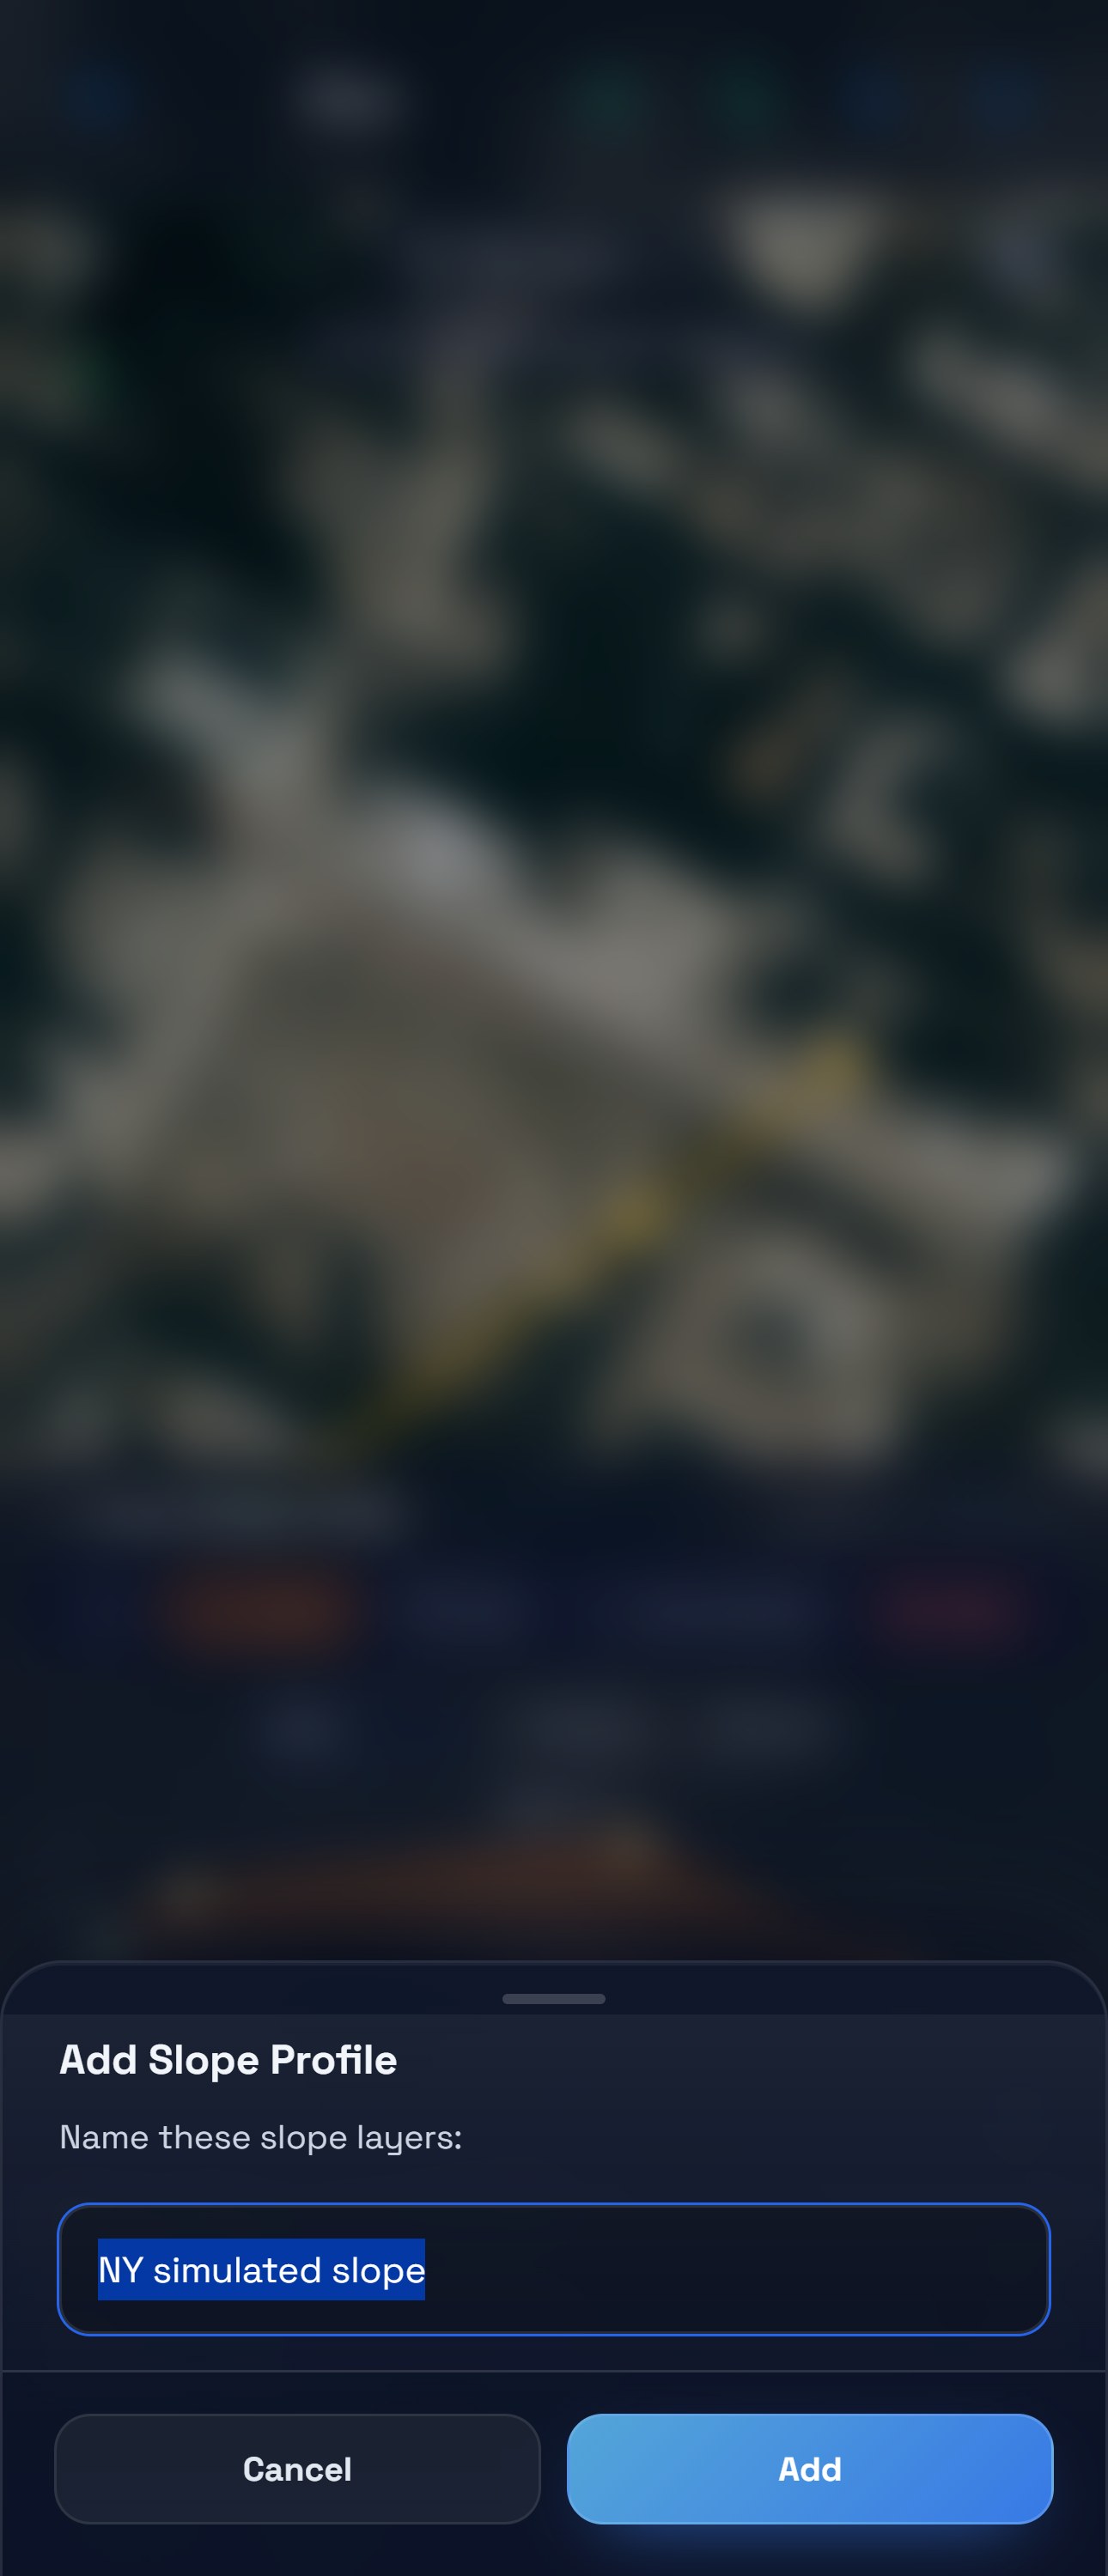
Choose Add, enter NY simulated slope, and confirm. This creates project data in two layers; Finish alone did not create them.
Open Data & Sync and verify the result:
| Layer | Features |
|---|---|
| NY simulated slope - Sections | 1 line |
| NY simulated slope - Stations | 4 points |
| Practice project total | 5 |
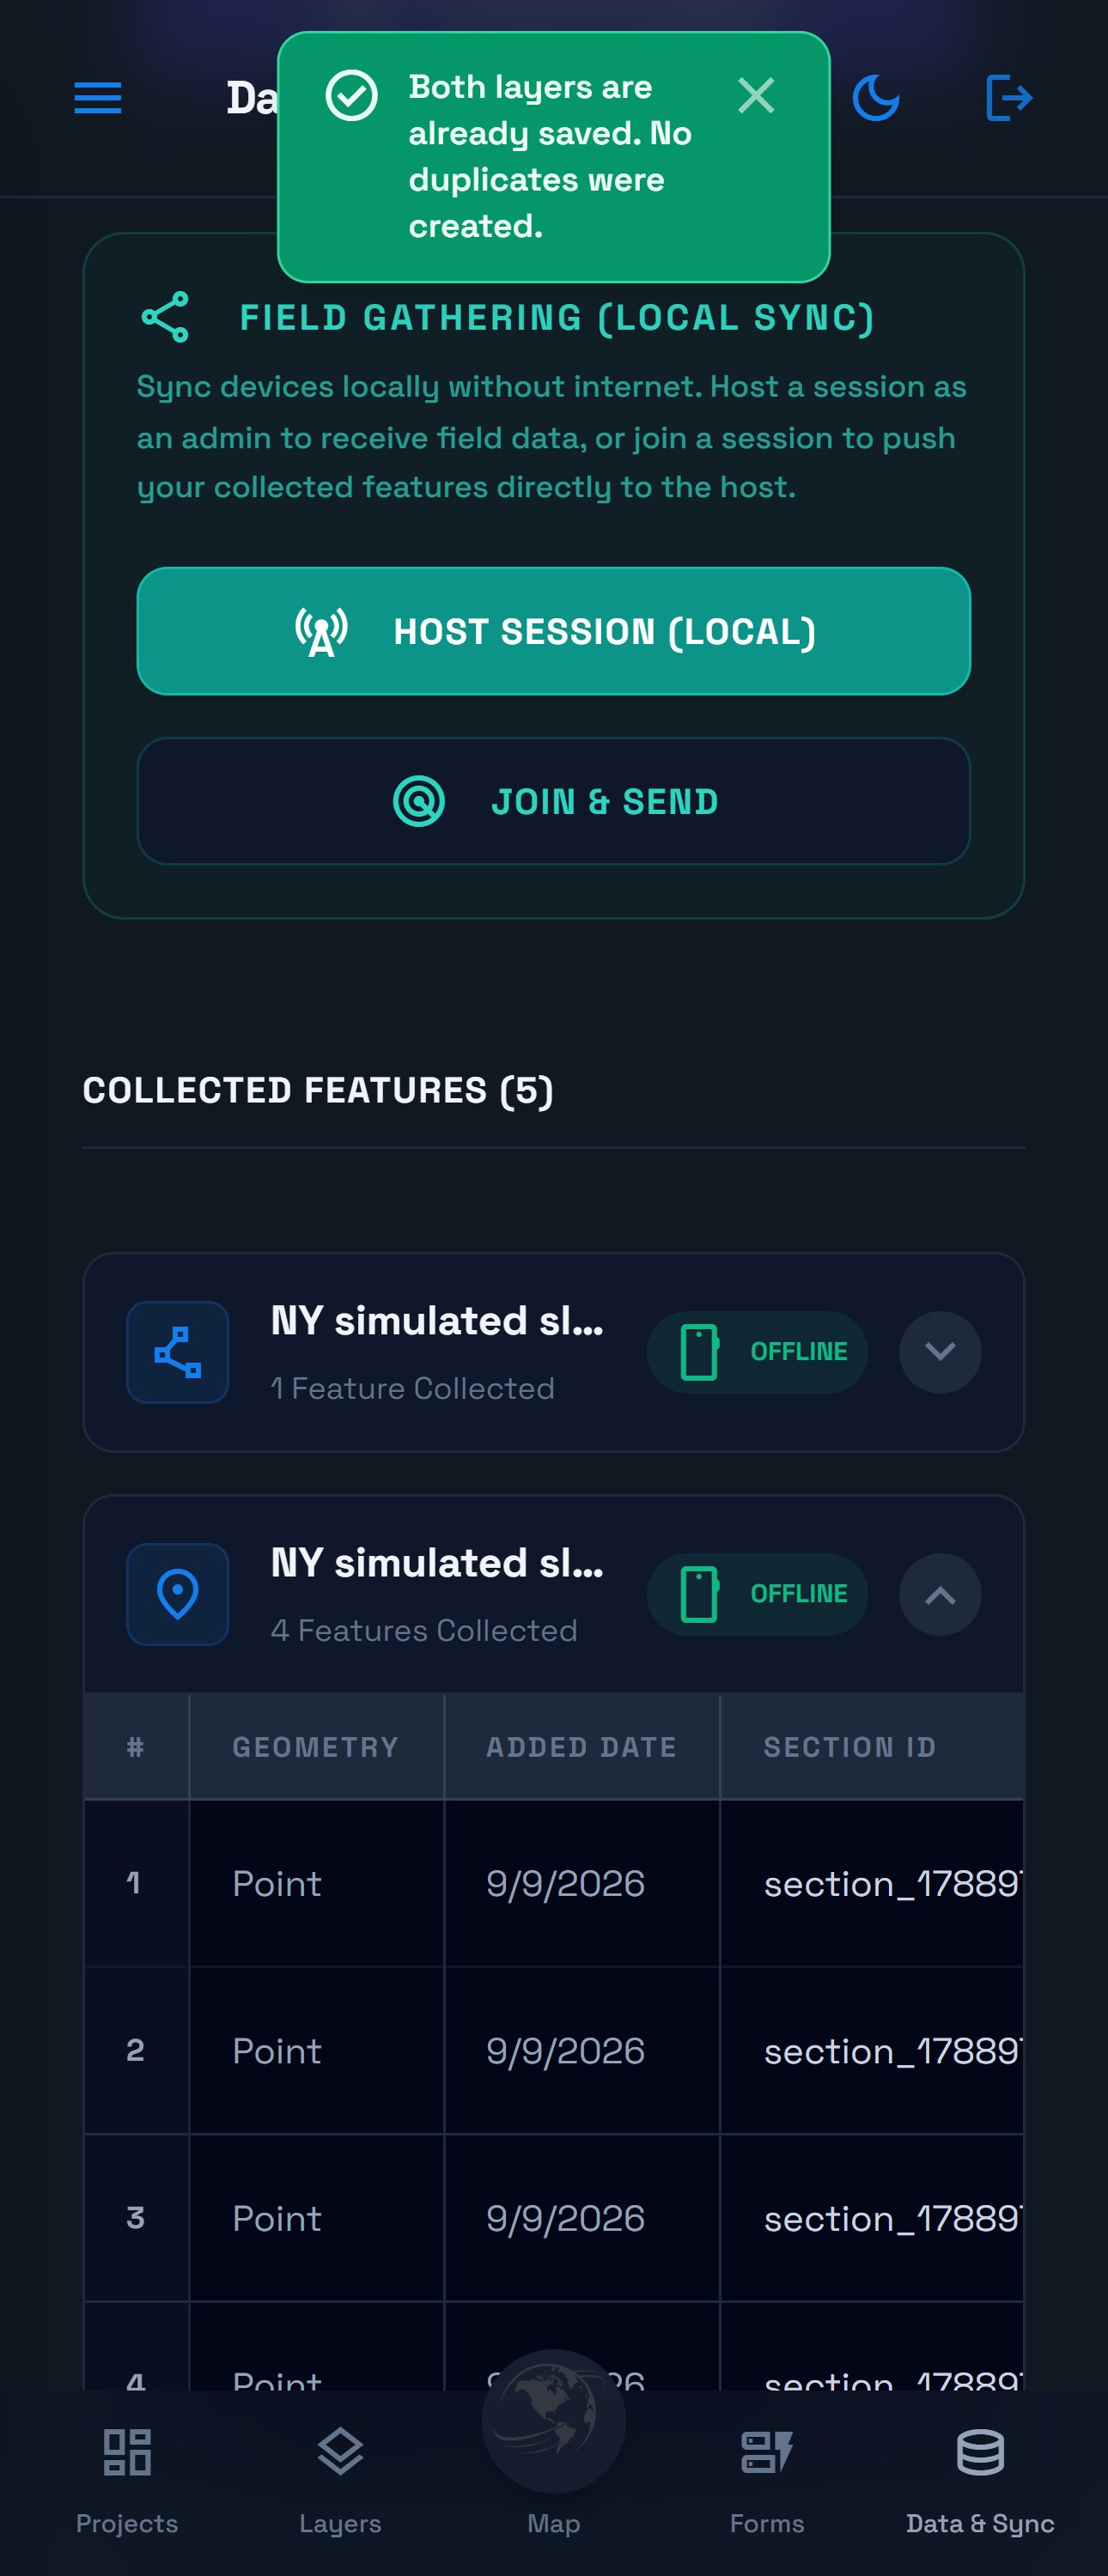
This project is local, so its Offline labels do not mean it was delivered to the Geova backend. In a hosted project, verify synchronization separately after adding layers.
7. Practise quality checks and recovery
- Open Settings in the profile sheet. Optionally enter a location-accuracy limit and a distance-from-section limit in metres. Choose values suited to the exercise; neither limit is a universal field standard. Leave either blank to disable it.
- Keep Warn when moving back toward A enabled while learning. A warning lets you cancel and reposition or explicitly record with retained quality flags.
- Observe Live · …s. A reading expires after the project maximum age, initially 15 seconds. Configure 2–120 seconds if required. Move the phone, return it to the measurement surface and wait for fresh input; a stationary sensor may not emit continuously. Refresh restarts sampling.
- After backgrounding the app, use Refresh before another observation. Already recorded stations and calibration remain.
- If Add is interrupted, reopen the tool and choose Resume Save. It uses the saved snapshot and names, even after restart. One layer may exist while the other is pending. Check both layers after recovery. Keep browser/app storage intact.
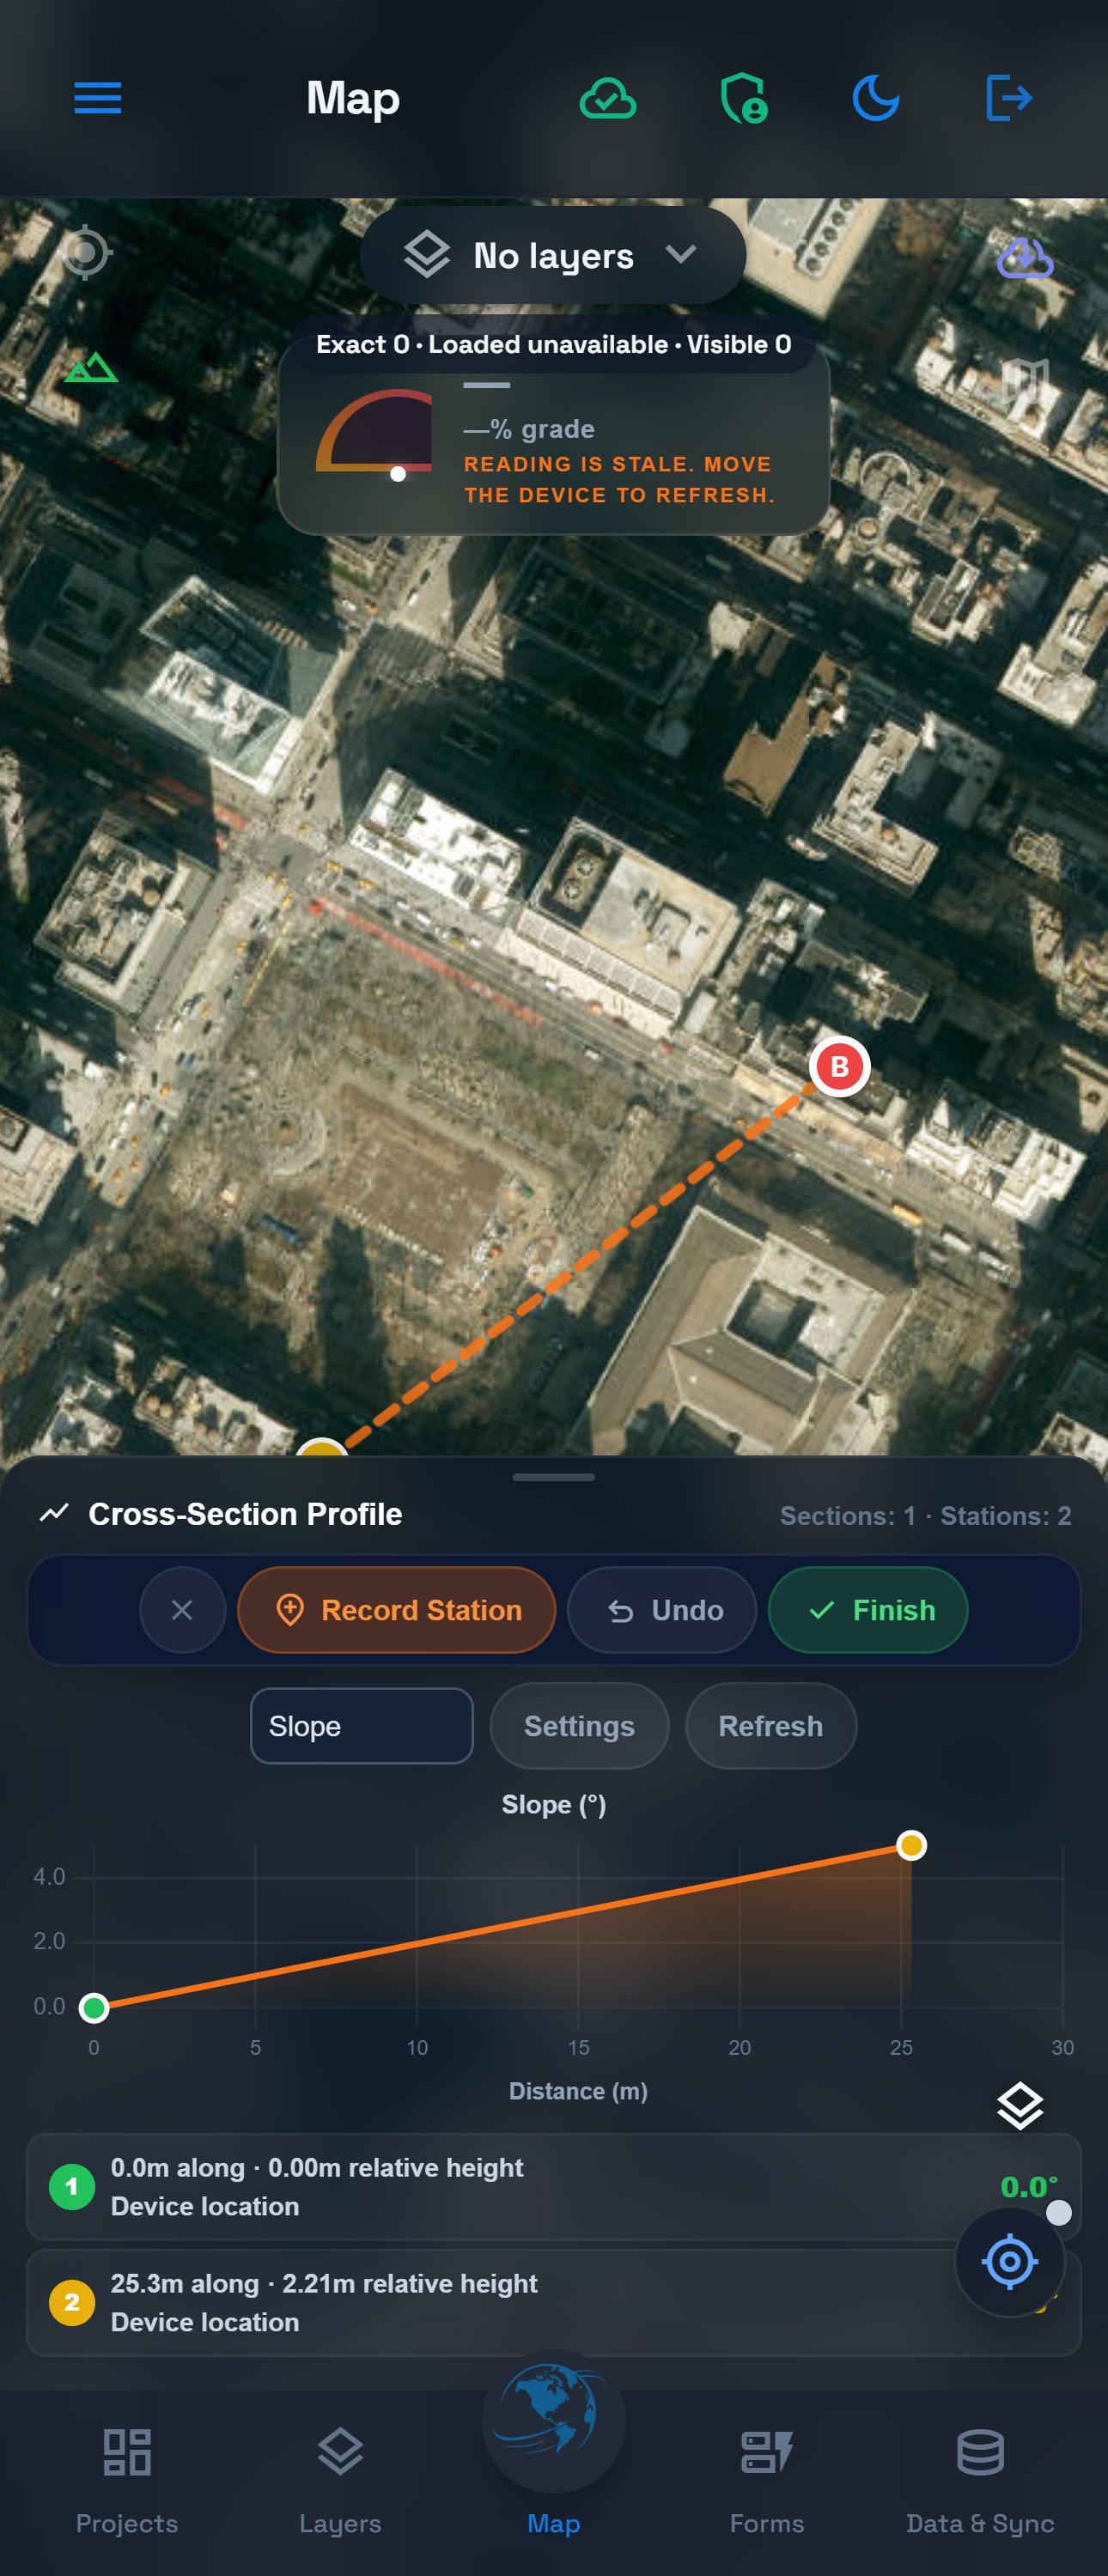
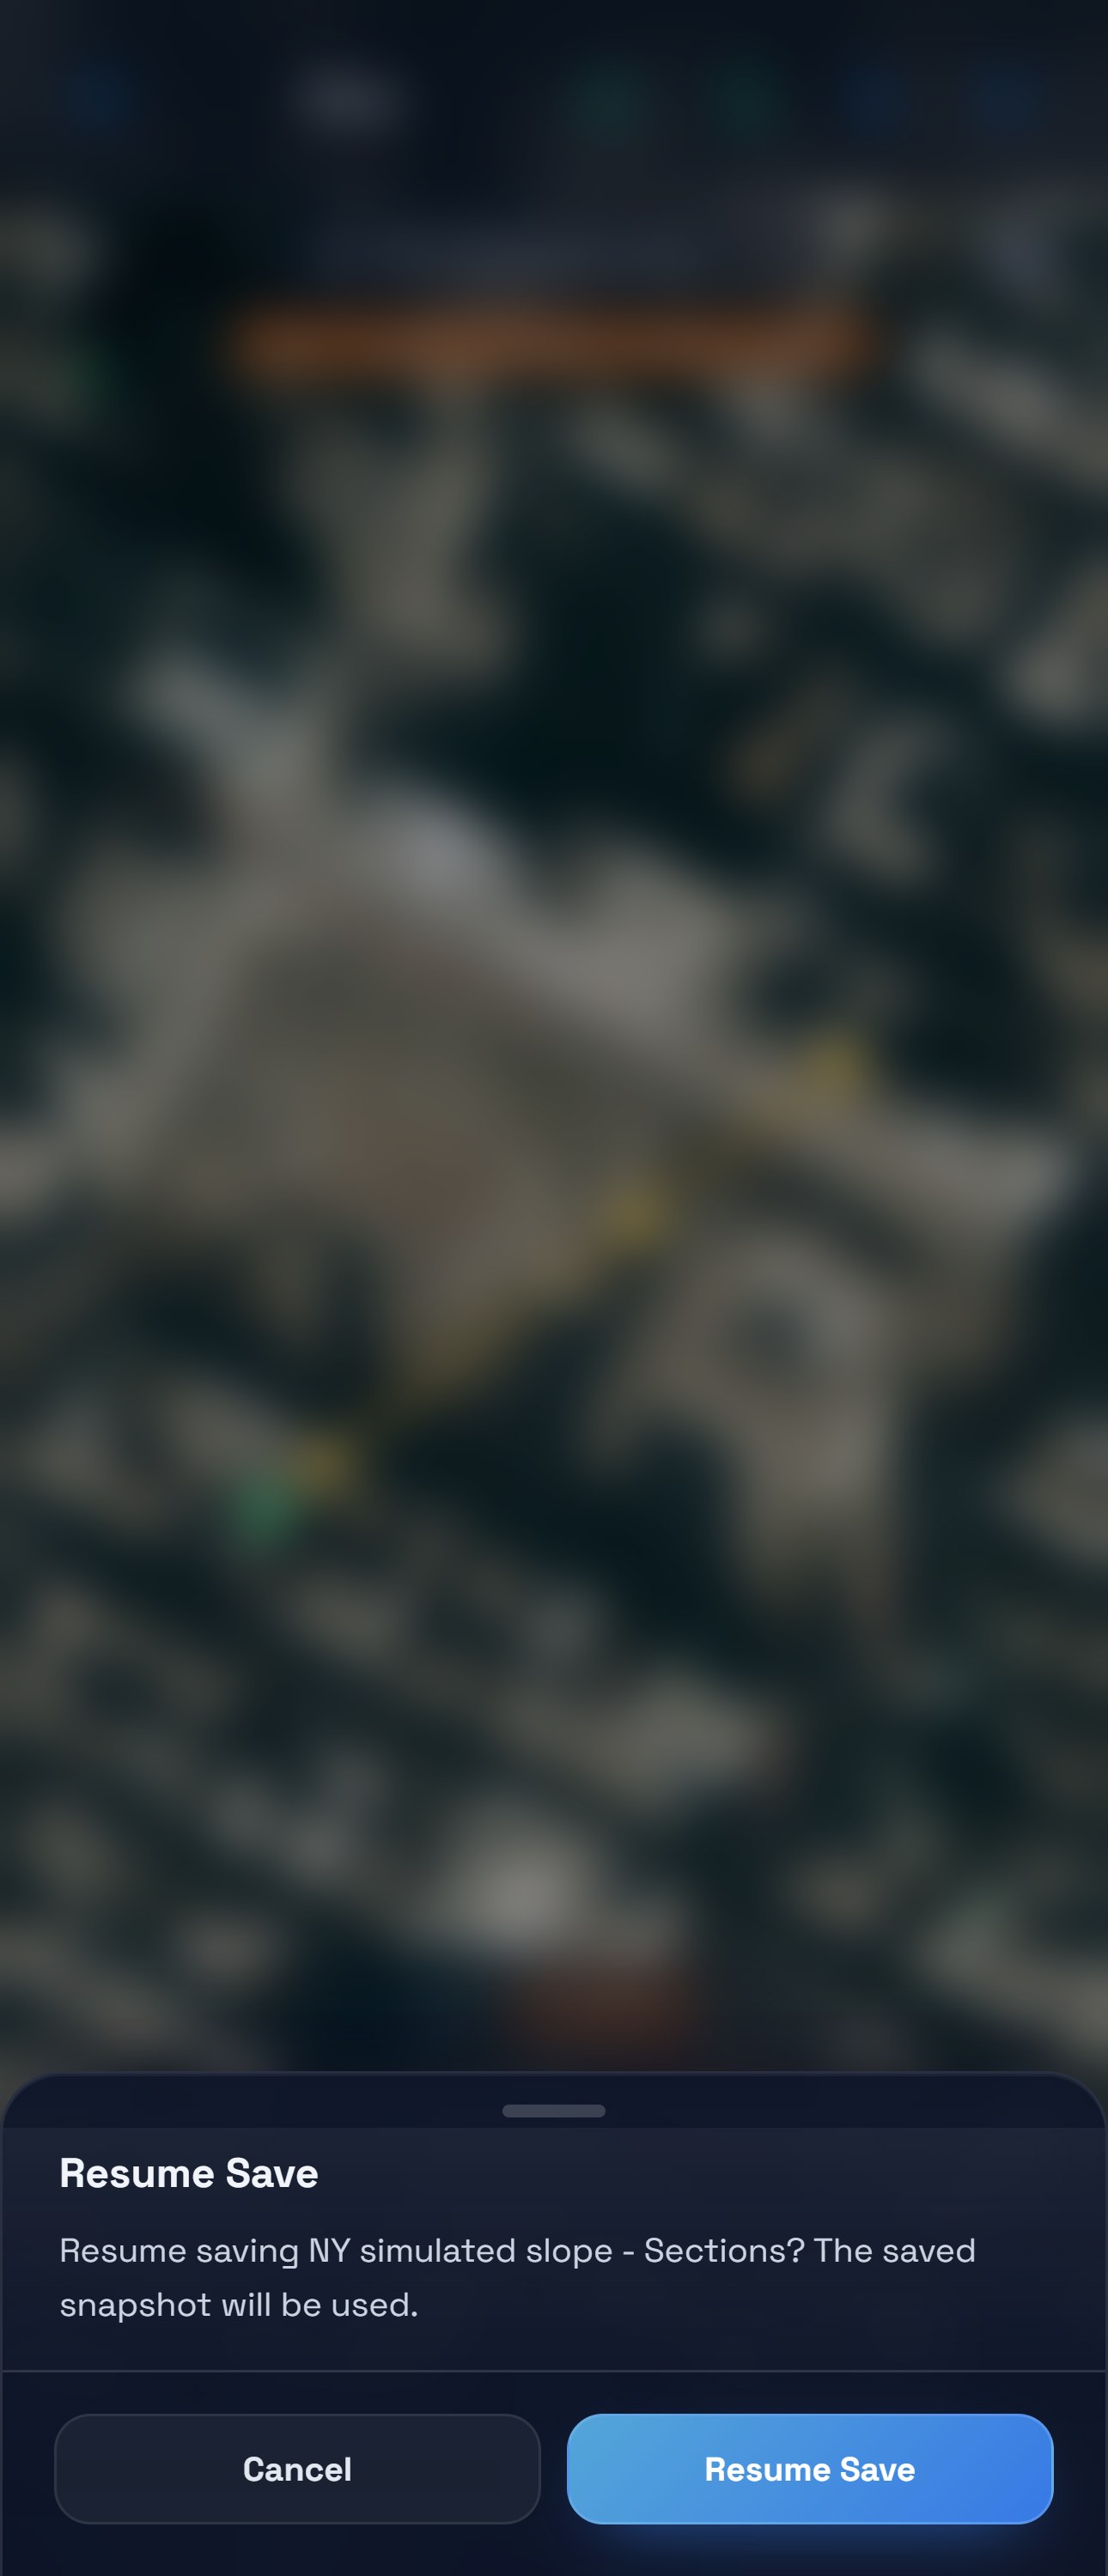
Resume continues collecting an unfinished section. Resume Save completes the snapshot captured by an earlier Add, including its original names. It does not substitute edits made afterward. Keep the recovery record on this device; older layers without such a record are not automatically matched to a new Add.
These current screenshots use actual Mapplex controls and isolated local practice projects. Sensor/location inputs and the save interruption were deliberately simulated. They verify software behavior, not physical sensor accuracy, Android permissions or hosted synchronization. Read the quality and recovery reference for details.
Completion checkpoint
You should be able to distinguish a drawn baseline, recorded stations, a locally retained profiler session, an exported file and project layers created by Add. Before leaving the tool, retain the result you need. Close hides the tool; Clear removes its local sections after confirmation and does not remove layers already added.
To continue an unfinished section: reopen the profiler and choose Resume. Your recorded stations and calibration are retained. The gauge shows — / WAITING FOR SENSOR until new input arrives; check that it responds to tilt, then record the next station. In the simulated check, a pre-close 5° reading changed to 10° after Resume, and the next station stored 10°. Recording before new input was blocked, and a delayed location result from before Close did not add a station. See Close and Resume controls.
For other controls, storage behavior and recovery, read the Slope Profiler reference. Return to Global walkthrough — start here to choose your next lesson.